.svg)
Industry insights
Jul 7, 2025
How we help customers solve the challenges of model-based design (MBD) in industrial R&D
Explore the common challenges we see in MBD workflows and how we help customers overcome them using Quix as the backbone for industrial data management.


Model-Based Design (MBD) is a popular approach to industrial R&D that promises to cut down development cycles and bring new products to market faster. It fits into the wider methodology of Model-Based Systems Engineering. However, the productivity gains from MBD are often dampened by the complexity involved in getting it to work properly. This complexity centers around data management—be it time-series results data, test configuration metadata, or simulation results. I’ve talked to a number of customers who are all frustrated by the same challenges which I’ve grouped into the following basic categories
- R&D data is extremely complicated and fast changing
- Teams rely on fragmented desktop-based tools that are developed in-house
- Getting data into simulation and modelling tools is unnecessarily difficult
I’ll examine each of these challenges in turn with the hope that each of them will resonate with you as well. Once we’ve established the root causes, I show you how the Quix team has been helping customers overcome these challenges by centralizing and standardizing the way they exchange data between systems.
R&D data is extremely complicated and fast changing
All companies must deal with data to some degree, but what distinguishes industrial R&D from other domains (i.e. finance or ecommerce) is the complexity and diversity of data that needs to be analyzed. This is a well-known issue in the industrial domain and I’ve covered it in detail when discussing the flow of data from OT systems to IT systems and how to manage data in the MBD lifecycle, but I’ll summarize it again here.
Managing Configuration data
Setting up experiments can be a time-consuming process. Before the process can start, an engineer must gather and input various configurations and metadata. These include scenario definitions, environmental boundary conditions, sensor channel mappings, asset information, test parameter files. They are also. A medium-sized manufacturer might have between 50 and 100 test chambers spread across multiple locations. To start an experiment, an engineer might have to copy several configuration and metadata files in disparate formats (JSON or INI files and spreadsheets) from multiple network drives to the local test bench workstation.
Manual configuration management is error prone
Because this process is so manual, it’s very easy for multiple inconsistent config versions to coexist. Some configuration settings themselves are also entered by hand. For example, engineers often use mapping config files to help automatically map raw channel IDs to human readable tags in the test bench software. However, they sometimes override these mappings and enter them manually instead, occasionally with typos. These manual changes cause issues for downstream data processing because it's harder to map the raw time series data to the originating configuration (since they don’t match the central mapping config)
Configuration metadata is also sometimes updated after the sensors stopped logging (often because the equipment in the test chamber changed but someone forgot to update some mapping information). The problem is, their tooling does not give them a reliable way to attach those changes to the data that had already been recorded.
Errors mean experiments have to be repeated—which can be extremly time-consuming
Lastly, configuration management is particularly tricky for long-running simulations. The parameters that define a simulation (model version, sensor names, calibration constants) are the principal configuration data. Because they live in scattered repos and ad-hoc scripts, any change forces engineers to reclone, re-edit and rerun the whole chain instead of triggering an automated, version-tracked job. That manual coupling of code and config makes repeatability and scaling nearly impossible.
Managing Time series data
As mentioned, the output of simulations and experiments is generally time-series data. Within each facility, there are numerous data sources to manage. You have data emitted from the PLC that's controlling the hardware under test, such as an air conditioning unit or a battery pack. Then there's data from the controller for the test chamber itself, which manages the environmental conditions. Finally, you have a host of additional sensors and probes that are installed in the hardware or test environment for specific measurements.
To determine the results of an experiment, you need to align and normalize the time-series data that all these systems produce. This is far from easy when you have data arriving in different intervals, with different timestamp formats, and often not in chronological order. A sensor might report on change, another every second. And as I mentioned in the configuration section, there are often inconsistent channel labels which need to be mapped to some kind of canonical, human-readable name.
This situation isn't anyone's fault; it's a natural consequence of domain experts focusing on their core discipline. Their primary job is thermodynamics or control theory, not building and maintaining centralised data systems. The organizational structure often reflects this, with hardware, software, and simulation teams working in silos, each with their own preferred tools and methods.
Generally, there is still a huge discrepancy between the size of the data challenge and the size of the software and data engineers working to solve it. I saw this with my own eyes while working at McLaren Applied. A typical Formula 1 team would have hundreds of mechanical engineers and but only a few software engineers and data engineers — typically in the double digits. This means you have an army of mechanical engineers to build tests and run experiments but a tiny team to manage the corresponding data processing infrastructure. Inevitably, some mechanical engineers will have to help manage the data because there are simply not enough software or data engineers to support them.
Teams rely on fragmented desktop-based tools that are developed in-house
Given such a complex infrastructure, engineers should build robust systems to manage their test and simulation data. The goal is to deliver a reproducible, single source of truth, version controlled, experiment data management system to the internal customers (mechanical engineers)
The problem is, there’s usually no standard way to move the data from one step to the next. Engineers usually write bespoke scripts to move and manage data. Sometimes, a human needs to manually copy files from one filesystem to another or import it into the next system each time they run a test.
Consider the following diagram which represents an amalgamation of different customer data systems

This illustration depicts a testing workflow that combines simulations with real physical hardware. Each colored arrow represents a different system that uses a distinct protocol, data structure or file format. You can see how data moves between on-site tools like test bench software, simulation applications, and various brokers and databases and. At each hand-off, there's a potential for friction.
For instance, an engineer might need to export a CSV from a simulation and import it into a time-series database. The database, however, may expect the data in a "long" format—one reading per row—whereas the simulation tool exported it in a "wide" format with timestamps as rows and sensors as columns. This necessitates a custom script just to restructure the data. The reverse is also true; getting historical data out of a database and into a format a simulation model can understand is another manual, error-prone task.
Another example: raw sensor data needs to be enriched with contextual metadata that describes the test run and the hardware being tested and so that another downstream system can calculate core metrics that quantify the test results. Someone needs to write and maintain the processing logic which is often stored and executed in different systems for each case.
These are just small examples of the many bespoke steps involved in moving data between systems. Each script and manual process takes time to develop and maintain, making the entire data pipeline extremely brittle and resistant to change.
Getting data into simulation and modelling tools is unnecessarily difficult
Many of the most powerful and well-established tools used in MBD were not originally designed to receive live data as input. For some models, it can be quite difficult to prepare the required input data for each new test run regardless of whether it is live data or not.
Live data is a primary input for hardware-in-the-loop (HiL) testing, where a physical controller is used to control a simulated model of the hardware. However, live data can also be immensely valuable in the earlier software-in-the-loop (SiL) stages. At this stage, both the controller and hardware are virtual models, but these models can use live data from a physical test chamber as boundary conditions. For instance, one customer might feed live sensor channels—like outdoor temperature and inlet water temperature—from a climate-chamber rig into a Functional Mock-up Unit (FMU) at each time-step. This allows the model to “ride along” with the physical unit and flag deviations on-the-fly.
This is where the inflexibility of common tools becomes a bottleneck.
In many teams, their primary engineering workflows are based on MATLAB and Simulink, which are often isolated from the rest of the automated test and simulation infrastructure. This isolation reduces reuse, slows down testing, and creates significant hurdles when they want to run models at scale, live during tests, or in replay scenarios. MATLAB can take a live data stream as input but the development overhead is often prohibitively expensive, pulling valuable resources away from the actual R&D work.
The same challenge applies to preparing data for Computational Fluid Dynamics (CFD). Before a team can run a CFD simulation, raw logs from multiple test rigs must first be trimmed, time-aligned, unit-converted, and reshaped into the rigid boundary-condition tables demanded by tools like ANSYS, STAR-CCM, or OpenFOAM. Any change in sensor naming, sampling rate, or data range can break that packaging process, forcing engineers to halt, regenerate days of input, and restart simulations that already consume up to a week of compute time. This preprocessing effort can often rival the solver runtime itself.
How we help solve these issues
All of these issues point to a lack of standardization and centralization. Our solution is to bring more of these disparate “scripts” into a single, cohesive environment, establishing a central nervous system for your data that provides standardized ways for systems to communicate.
Removing system fragmentation with a central pipeline for a unified data flow
When onboarding new customers, a core objective is to establish a central pipeline that all data flows through. Instead of multiple point-to-point connections between systems, everything runs inside Quix—a single platform that handles data ingestion, processing, and delivery.
Consider the following diagram, which abstracts away many of the connections in the previous pipeline example:

Here, we use the Quix MQTT connector (6) to read messages from the MQTT broker, so that live test data is stored within Quix
Once the data is in the platform, the "scripts" that previously held everything together are replaced by processing services that live within the pipeline (7). Each process uses the Kafka messaging framework to send and receive data, so data exchange is standardized. Each service consists of a continuously running processing application that lives in a Docker container with its own dedicated CPU and memory resources. The services listen for new data and process it as soon as it arrives—no batch jobs needed.
A data normalization service can take the raw, asynchronous sensor streams and transform them into a clean, tabular format. This processed data can then be passed to other services or sinks. This also allows for a clean separation of concerns in storage: the raw time-series data can be persisted in a dedicated database like InfluxDB, while all the associated metadata resides in a document store like MongoDB.
By collapsing every data hand-off—live sensor capture, schema-aware normalization, metadata enrichment, and solver-ready delivery—into one event-driven pipeline, Quix replaces brittle glue code with a resilient backbone that scales automatically and records an auditable lineage for every byte. Engineers can launch experiments in minutes instead of days, new rigs or analytics tools plug straight into the same stream, and the organization gains a single source of truth that future-proofs both compliance and collaboration.
Connecting isolated tools like MATLAB and Simulink
In this new setup, we also try to move the entire simulation workflow out of the VMs and into Quix too. Each kind of simulation, whether it be a Simulink model, CFD, or 1D FMU is run in a Docker container that can be horizontally scaled with replicas.
Dockerizing simulations for better scalability
Some engineers are reluctant to run and orchestrate a large number of Dockerized applications because it necessitates the use of Kubernetes, a very complex system that requires significant expertise. Fortunately, we’ve put a lot of thought into abstracting away this complexity in the Quix platform. You just need to think about memory, CPU and how many replicas of a simulation you want to run.
Of course it’s not all plain sailing to migrate simulations into Quix. MATLAB’s licensing model makes it challenging to run in containers but we’ve a couple of projects with customers who have done just that—so we’ve learned how to build, deploy and scale MATLAB containers in Quix with minimal hassle.
That effort has paid off. We’ve seen customers run parameter sweeps and design-of-experiments studies, by spawning multiple replicas in Quix, each processing a different scenario. Ten licenses can run ten scenarios simultaneously, reducing wall-clock time by up to 10x.
Automating data-related busywork for simulations
But increased compute capacity isn’t the main benefit—it’s the fact that the models are now connected to the rest of the data pipeline. By leveraging MATLAB Streaming Data Framework, customers can run iterative computations that process live data streams in segments. What this means practically is that they can test their controller functions using live test chamber data as input. And the output is also incremental, with results emitted as messages to Kafka topics rather than a giant CSV dump at the end of the simulation run.
Quix also helps to simplify the cumbersome process of preparing data for long-running CFD simulations. Because all the relevant data lives in Quix, the "pack-and-normalize" step can be implemented as an automated, repeatable pipeline. It can pull historical data from the database, perform all the necessary trimming, alignment, and reshaping, and then deliver a perfectly formatted input file to the CFD solver. This transforms a brittle, manual task into a robust, automated workflow. If any issue occurs with the solver due to a misconfiguration, the whole process can be easily replayed again with the right configuration.
A lot of this is made possible with the Quix configuration service.
Centralizing metadata with a configuration service
For most customers, the main input for a simulation is metadata rather than time-series data. This metadata includes static boundary conditions for the simulation, mapping channel IDs to human readable labels, scenario definitions, and so on. But of course this metadata changes for every test, so each “bundle” of metadata needs to be versioned and tied to the data from the corresponding test run.
This is the metadata enrichment stage which most have customers in place already. The problem is that the enrichment aspect is fragile and inconsistent across live testing and simulation workflows
To solve this problem, we’ve built a configuration service that unifies the data. The following diagram shows how the config service lists for config changes from the testing application and writes versioned config snapshots into Quix Cloud.

This service acts as the single source of truth for all metadata. You can define a mapping schema for each test bench, which maps cryptic channel IDs to human-readable information like descriptions, units, and physical sensor IDs. This provides a stable baseline.
For each specific test run, a "Test Definition" document is created. This captures all the static information for that run: the test ID, the campaign it belongs to, the engineer conducting it, and the specific sample being tested.
Most importantly, this system can manage the dynamic context. A sensor's purpose might change during a test; for instance, as the machine switches from one cycle to another. The on-site test bench tool can send a simple API call to the configuration service to update this "Measurement Point" (MP) in real-time. The result is that data becomes queryable by its semantic meaning, not just its hardware identifier, which is a massive productivity boost for anyone analyzing the data in Grafana or other tools.
Empowering engineers by abstracting away complexity
The growing enthusiasm for solutions like Quix is heartening. It means more companies are recognizing that the traditional approach of treating data management as an afterthought, solved by individual engineers with custom scripts, is no longer sustainable. The competitive pressures are too intense for ad-hoc solutions.
Engineers shouldn’t be spending their time wiring up storage, writing boilerplate connectors, or maintaining fragile glue code. The value isn’t in the plumbing—it’s in the insights that come from good models, clean test data, and fast feedback. A shared platform should handle the repetitive, low-level parts so teams can focus on the actual engineering.
That said, flexibility still matters. The goal isn’t to replace ad-hoc scripts with another rigid, one-size-fits-all system. It’s to give engineers a stable, reusable foundation that still lets them define their own measurement points, adapt metadata fields for new tests, or plug in custom analytics. You get a system that’s robust enough for long-term use, but open enough that teams don’t have to fight it every time requirements change.
If the problems that I’ve outlined resonate with you, maybe it's time to ask your team how much longer they can afford to tolerate the drag on productivity when there are solutions out there to mitigate it. After all, when you remove the friction of data logistics, you unlock the full potential of your R&D talent which ultimately helps your organization bring products to market faster. When you have free-flowing data to oil the gears, you can finally realize the full potential of MBD.
Last updated:
Jul 14, 2025

Check out the repo
Our Python client library is open source, and brings DataFrames and the Python ecosystem to stream processing.
Interested in Quix Cloud?
Take a look around and explore the features of our platform.
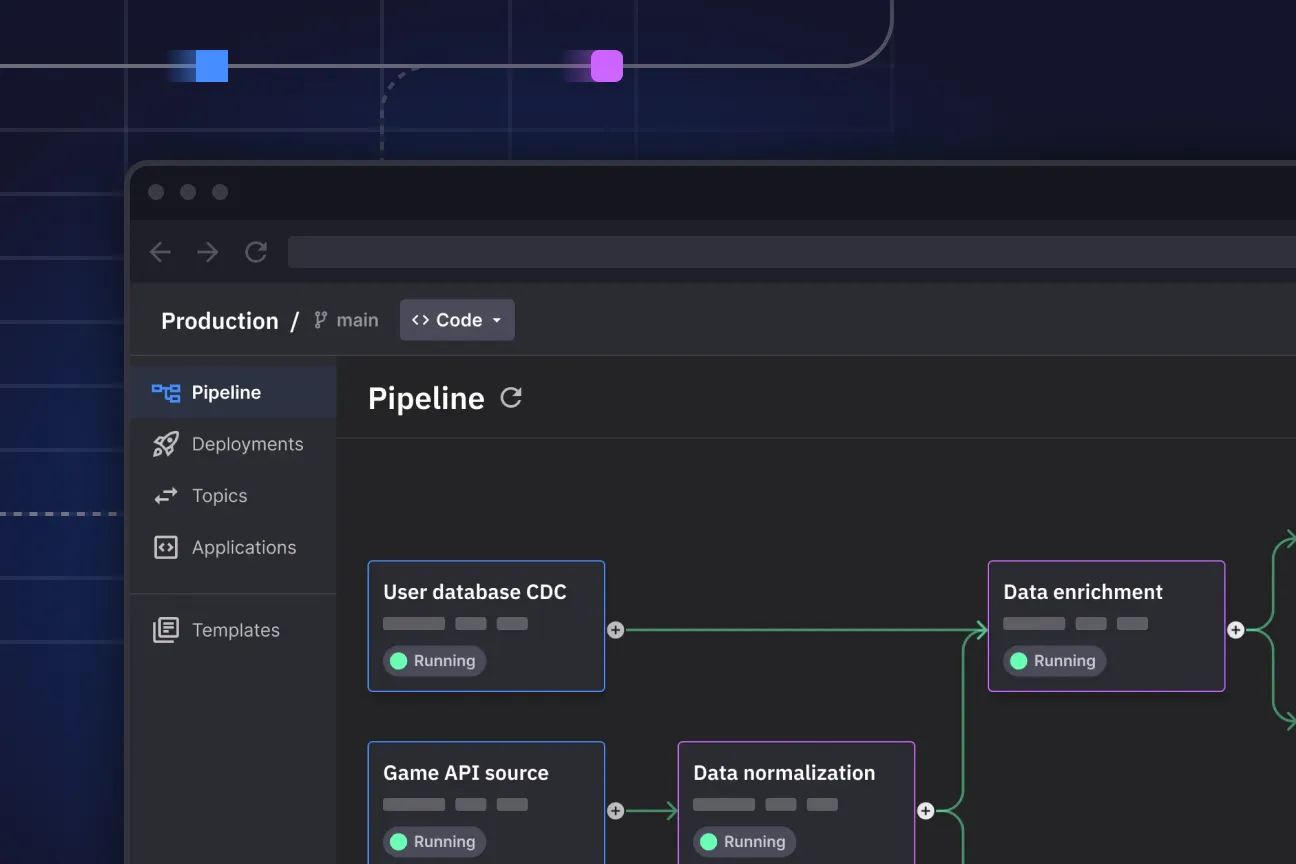
Interested in Quix Cloud?
Take a look around and explore the features of our platform.