.svg)
Use Cases
Mar 28, 2023
Exploring real-time and batch analytics for e-bike telemetry with Quix and AWS
How Brompton's experiments with Quix and AWS technology are paving the way for an enhanced e-bike riding experience.


Introduction
To get from A to B, commuters in bustling cities often combine bike journeys with public transport. It’s these very commuters who are being courted by Brompton—one of the UK's top bike manufacturers. Each Brompton bicycle is handmade, collapsible, and designed for city commuters—especially those who use the train.
This major brand launched their first battery-powered bike in 2017, and are currently developing a next-generation, connected e-bike. Because it’s their first software-enabled bike, they were confronted with a new set of IoT-related challenges such as building out the system architecture to manage a fleet of connected devices.
To get a better sense of what is possible, they ran an experimental project with Quix and Amazon Web Services (AWS)—two technology companies that have ample experience with managing big data collected from connected devices.
The collaboration between Quix and AWS
For this research project, Quix first helped Brompton to get their telemetry processing up and running. This involved developing prototype versions of a mobile app and a real-time data processing pipeline.
The prototype mobile app is designed to send data to the Quix platform hosted in the cloud.
This raw data includes information such as location, elevation, distance traveled, speeds, acceleration and battery power.
Once the data is ingested into the Quix platform, it can be turned into actionable insights.
For example, estimates a battery's remaining mileage can be sent back the mobile app by using specific algorithms to analyze the telemetry in real-time.
Then, Brompton selected AWS to store the telemetry data collected during the prototyping process. AWS offers a rich set of data warehousing and batch processing capabilities, which can enable Brompton to generate further insights for both customers and internal business users.
First Brompton needed to understand what was possible, so they created a test pipeline that used a broad set of AWS services that touch every aspect of the batch processing pipeline, including object storage, ETL (Extract, Transform, and Load), data warehousing, data visualization and dashboard creation.
To ensure that the prototype was a success, Quix and AWS worked together to ensure that data could easily flow between the two systems.
The challenge
Brompton is still working on building their IoT expertise while managing the day-to-day work of designing and manufacturing high-quality, foldable bikes. As with many companies, they’re also trying to streamline how operational data is stored and organized.
For example, data from various systems (e.g. customer application, diagnostics, ERP, PIC, CMS, fleet) are not currently shared across departments, and the current factory-focused setup is not yet ready to support the flow of data across their future set of digital products and services.
To find a long-term solution for these issues, Brompton decided to sketch out a new digital infrastructure that can enable seamless integration between their next generation of e-bikes and the systems needed to serve both end customers and internal business users.
This experimental infrastructure would join fleet management, telemetry and OTA application data into a centralized data hub. Pairing the bike with a companion mobile app would make it possible to capture richer data such as high-rate logging and battery performance and store it in a data warehouse, paving the way for more advanced use-cases such as training machine learning models for anomaly detection.
The solution
To help Brompton get up and running, Quix and AWS worked together to put the real-time and static data in one central location.
Moving bike data from mobile app to data warehouse
Brompton needed to process the bike data to fulfill several business functions such as mileage estimation and firmware updates. But before these functions could be applied, the data must first be ingested into the pipeline.
Here’s a summary of how it works:
- The rider pairs their phone with the bike using the mobile ap
— They can use the app to view diagnostic information about the bike, such as distance traveled and battery status.
— The app also connects to systems in the cloud so that it can keep the bike’s firmware up to date and transmit telemetry for bike journeys.
- The data is sent to Quix and written to a Kafka topic on the Quix platform
— Once the data is inside Quix, data scientists can write different serverless functions in Python to process it.
— One such function is mileage estimation. Riders need an accurate estimate of how far they can ride before they run out of battery and have to rely on muscle power alone.
Here’s an overview of where the mileage estimation function fits within the first part of the pipeline:

How a bike’s remaining mileage is estimated
The estimation function uses real-time ride data like the battery’s rate of discharge, and riding speed (all sent via the mobile app) coupled with the ambient temperature at the rider's location (pulled from OpenWeather’s weather API).
The following screenshots from the Quix platform show the data pipeline and the serverless function that estimates the battery range.


The results of this pipeline are then sent from Quix back to the phone so that the rider sees the mileage estimation in real time.
In a second version of the prototype, the results will also be written to Amazon DynamoDB, which is a fully managed, serverless, key-value NoSQL database designed to run high-performance applications at any scale. The aggregated data will then be exposed via a data API so that other systems can analyze the historical mileage estimates.
The following diagram highlights how this particular use case is reflected within the wider context of the cloud infrastructure hosted in Quix and AWS:

Load testing the pipeline by simulating 10,000 bike rides
Before putting a real-time pipeline into production, it’s crucial that it can handle high volumes of concurrent data streams. For this test prototype, the team decided that the system should be able to handle data from 10,000 simultaneous bike rides. However, since there aren’t enough riders yet to test with real-world data, they opted to simulate the ride data instead.
They implemented the simulation in Quix and used it to load test the systems hosted within AWS. The solution was simple but effective. A Quix specialist wrote a “demuxer” serverless function that took the data from a handful of actual rides and extrapolated it out to data for thousands of rides. This demuxing process (separating multiple signals from a single source) was used to randomize different data points such as coordinates, outside temperature and ride timestamps. The results were then used to create 10,000 separate data streams.
However, creating so many concurrent streams could not be done using a single server instance. Quix uses Kubernetes under the hood to automatically provision multiple replicas and spawn multiple instances of the demuxer function. By increasing the replica count in the Quix settings, the Quix specialists were able to easily obtain the compute power they needed to run their load testing.
The following screenshots from the Quix platform show the data pipeline and the serverless function that does the demuxing, including its deployment settings (with replica count highlighted) and source code:


Streaming to Amazon Kinesis Data Firehose
Looking at the pipeline in Quix, one can see that the output of the demuxer is sent to Amazon Kinesis Data Firehose. Kinesis Data Firehose buffers data and converts real-time data to make it suitable for batch analytics (in services such as Amazon Redshift and Amazon Quicksight) in a manner that prevents them from being overloaded with too many concurrent messages.
Kinesis Data Firehose also converts the data into the Parquet format so that it can be stored and processed efficiently. The Parquet files are subsequently written to Amazon S3 storage for historical analysis.
All of this was made possible with the Quix Kinesis Connector. The Quix and AWS teams worked together to create this open-source connector to efficiently move high-frequency data from Quix into AWS. When trying out different solutions, they also created connectors for other AWS services such as Amazon Redshift, Amazon DynamoDB, and S3. These connectors can all be used by any other AWS customer to ingest data from Quix.
The following diagram summarizes how the bike manufacturer pipes the simulated data from Quix into AWS to be consumed by various AWS services:

In this prototype pipeline, each service played a specific role and was designed to fulfill requirements for different user personas:
- Amazon S3 (Simple Storage Service) was used to archive Parquet files which contain historical bike telemetry data. S3 was also used to store static data such as inventory and service details about individual bikes. S3 is very popular for big data use cases like this because it’s highly scalable and can store billions of objects, with automatic and infinite scalability of storage capacity.
- Amazon Redshift was used to store transformed views of the raw telemetry data. This enabled Brompton stakeholders to load and query bike data that has been enriched from other sources such as bike parts databases and service history logs. Redshift uses columnar storage and advanced query optimization techniques to deliver fast query performance.

Amazon Athena was also introduced to showcase how users run SQL queries on the data directly in S3 without waiting for any ETL process to transform it and load it into Redshift. Athena is a more advanced, serverless query service that allows for direct querying of data stored in Amazon S3 without the need for a database cluster or infrastructure management. It supports multiple data formats and can be used with various analytics tools for ad-hoc analysis of historical data.
- Amazon QuickSight was used to help Brompton understand the possibilities of data visualization and how their data can generate actionable insights for both customers and internal business users. This service includes an intuitive, drag-and-drop interface for data preparation and visualization, and supports the other data sources involved in the project such as Amazon Redshift and Amazon S3. With QuickSight, Brompton stakeholders can generate interactive dashboards to quickly uncover data driven insights. Non-technical users can also ask questions and get answers with relevant visualization by enabling QuickSight Q, which generates an answer using natural language.

- AWS Glue and AWS Glue DataBrew were used to help move Brompton’s data between the different AWS services and to understand relationships within the data. AWS Glue is a fully managed, cloud-based, extract, transform, and load (ETL) service which connects the previously mentioned services (such as Amazon S3 and Amazon Redshift). The service is highly scalable and can process billions of records in just a few minutes.

Looking to the future
The urban mobility market is evolving fast as consumers seek alternative ways to navigate congested cities. Innovation is key to standing out in a crowded market, and data is the fuel that drives it. However, it’s no simple task to transform the raw data into insights and value for the customer—especially if you’re a bike vendor that specializes in hardware. That’s why the Brompton ran a prototype with two technology companies that specialize in real-time and batch data processing: Quix and AWS.
By leveraging the real-time data processing expertise of Quix and the batch data processing capabilities of AWS, Brompton gained a deep understanding of how they could make the most of the large volumes of telemetry data that hey will collect.
And by analyzing the data with both real-time and batch processes, Brompton will be able to able to envisage how they could provide better functionality for their customers such as mileage estimates for their newest e-bikes. They now understand what is required to efficiently store and process the vast volumes of telemetry data. In the long-term, this potential new capability could enable them to serve their customers even better, as they can use data to customize their products to their customers’ usage patterns.
For example, in a follow-up prototype, Brompton is exploring how to integrate further AWS services such as DynamoDB, AWS Lambda and Amazon API Gateway. These services could work together to expose historical mileage estimates through an API. This API-based approach could then enable other teams to apply machine learning to the historical telemetry data and bring their connected e-bikes to the next level. With the help of machine learning, Brompton can then unlock richer and more precise insights for both customers and internal business users.
Conclusion
Brompton’s forward-thinking research collaboration with Quix and AWS serves as a useful blueprint for other hardware vendors who are looking to enhance their products by connecting them to the cloud.
As IoT technology becomes increasingly accessible, more traditional businesses are utilizing telemetry data to gain deeper insights from IoT-enabled hardware. These businesses recognize that the availability of quality data is now a crucial factor for driving innovation and maintaining a competitive edge. However, capturing and leveraging this data efficiently requires acquiring a whole new set of competencies. The best way to develop these competencies is by collaborating with skilled and experienced technology partners who understand the unique challenges faced by hardware vendors.
Such collaborations can only be encouraged, because when hardware and software companies collaborate effectively, they can ignite powerful paradigm shifts that optimize energy consumption and make cities more sustainable.
Last updated:
Dec 12, 2023
Check out the repo
Our Python client library is open source, and brings DataFrames and the Python ecosystem to stream processing.
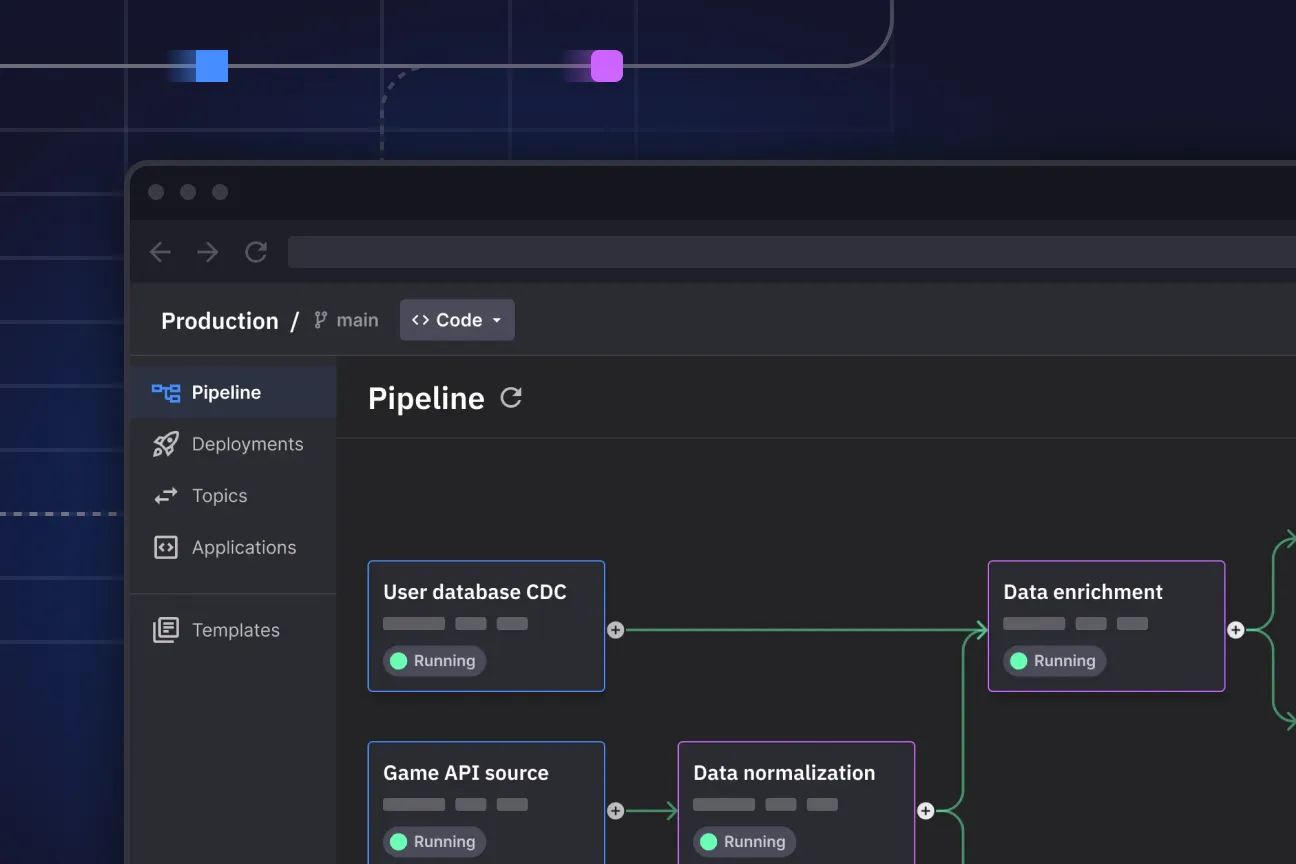
Interested in Quix Cloud?
Take a look around and explore the features of our platform.
Interested in Quix Cloud?
Take a look around and explore the features of our platform.


