How to develop a usage-based pricing system
How we engineered usage-based pricing on a message broker, with an in-depth guide to technical implementation and code samples.
Alert: This post includes details about Quix that are no longer accurate. We have updated information here.
How we built it: a deep dive on the technical implementation of usage-based billing
With usage-based pricing, customers pay for what they use — no more, no less. For example, a database company might charge a fractional dollar for each byte of data written to a disk. Or think about all those scooters on the road. Companies like Voi base prices on time and distance. Half of all SaaS companies report using a usage-based price model, so this list of examples could continue for a while.
When executed well, customers appreciate consumption-based models. But they can be challenging to implement.
Our last post explained why Quix adopted a usage-based pricing model because it maximizes value for our customers and company. This article describes how we built it and how we minimized the number of headaches along the way.
The requirements for our usage-based billing system
When we started discussing how to construct our usage-based billing system, we established some criteria to fulfill the needs of the solution:
- It must measure usage precisely (mainly time series data)
- It will have to process a tremendous amount of measurements per second
- It must process data continuously and create events such as “Run out of credits”
- It must scale efficiently from a few users to hundreds of thousands of users
- It must be resilient to failures. Never lose data or process it incorrectly.
- It can’t cost the Earth to run
If you’ve spent some time with software architecture, you’ll immediately notice these are demanding requirements. Let’s take a look at our options for meeting them:
Use a database
We could write our data to a database like InfluxDB or S3 and write services to query the data regularly, saving results to another table. However, in our experience, DBs struggle to process billions of measurements per second, don’t scale well because of the amount of disk space required, have a poor response time at this scale and don’t help prevent failure in the data processing services.
Use Lambdas or Functions
We could write many services to process the data, pass it along a pipeline, and write results off to a DB at each step. Despite being simple to use, self healing and elastic, these services suffer from trade-offs that make them less suitable for a mission-critical, data-intensive application. They don’t scale horizontally quickly, they don’t provide a persistence layer for the data, and they suffer from cold-start delays, which compound the previous problem of not having a data persistence layer.
Use a message broker
Message brokers are much more suitable for data-intensive applications like this. They keep the data in memory while it’s being processed, which a) reduces I/O pressure on your disks and b) provides a persistence layer for resilient processing. They also scale horizontally much more quickly than sharding databases.
Apache Kafka is the current industry-leading broker. It performs well on a large scale with high throughput, low latency and includes scalability features such as partitions and data replication.
However, Kafka itself isn’t enough. A team wanting to reliably process this volume of data at scale will have to choose, configure and maintain some (probably) Kubernetes clusters that run a stream processing library like Spark, Flink or Kafka Streams.
Now things are looking complicated with Kafka + Kubernetes + Spark.
Why we chose to build our usage-based billing system on Quix
This is where Quix comes in.
Quix provides a managed Kafka and a managed Kubernetes that are made very accessible by the Quix SDK, an abstraction layer on top of these technologies. The SDK codebase solves all the problems of scale and resiliency that we discovered while previously working with Kafka, Spark and Flink — and wraps everything into an easy library interface. Our billing system still isn’t simple to build, but Quix made it more accessible.
High-level architecture of our billing system
The Quix billing system’s architecture is based on a typical stream processing pipeline with a microservice implementing each processing step. The major elements in Figure 1 are:
- Consumption data sources are the elements of our product backend that generate consumption data (our API services, Kubernetes pods and data storage discs). They are services that send data to the pipeline using our SDK or HTTP APIs.
- Context mapping is the services that add business context (OrganizationID, WorkspaceID, DeploymentID, etc.) to each billable item. Raw data in a processing pipeline typically doesn’t contain all the necessary information for the next steps in the pipeline. This service adds it from external systems via a cache.
- Credit Service takes all consumption data and calculates a price in Quix credits. It also tracks the speed at which credits are consumed and calculates the remaining credits at any given point. It then generates events and sends all the processed data back to the pipeline.
- Aggregators are services that downsample the raw data into one-minute and one-hour aggregations. We save all the data to the time-series database for our invoicing, reconciliation and accounting needs.
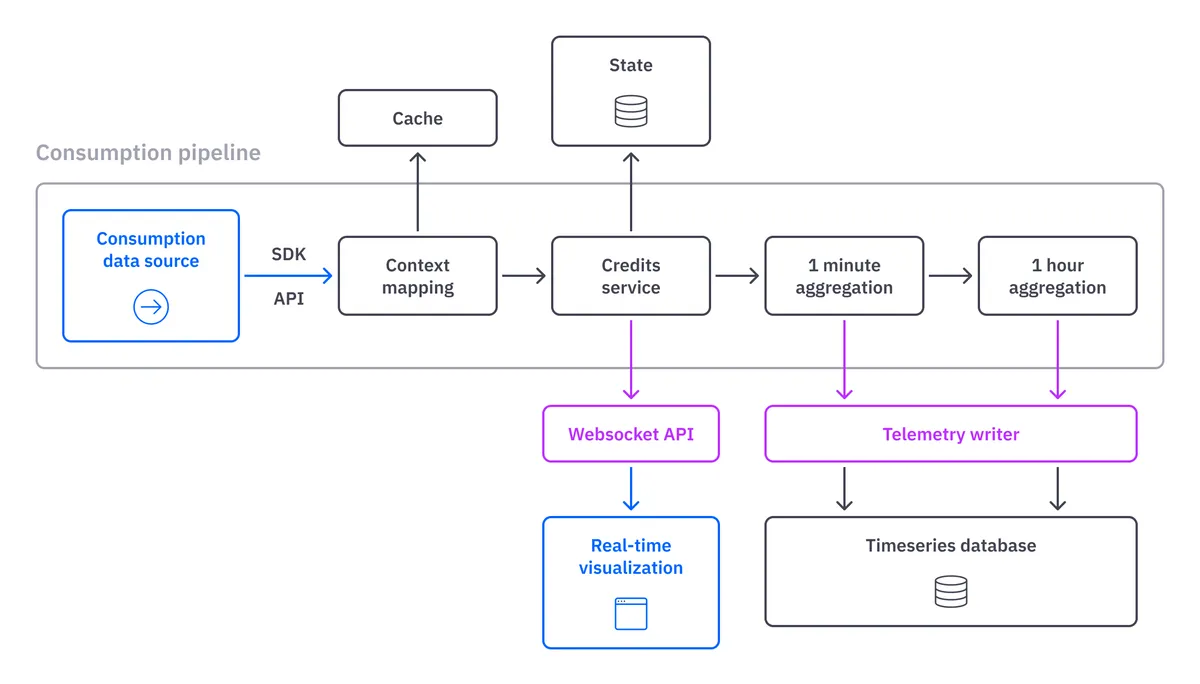
Figure 1: A high-level architecture of the Quix billing system
We have 13 consumable resources to track in Quix. Although they converge in the same physical pipeline, each needs a different theoretical processing pipeline.
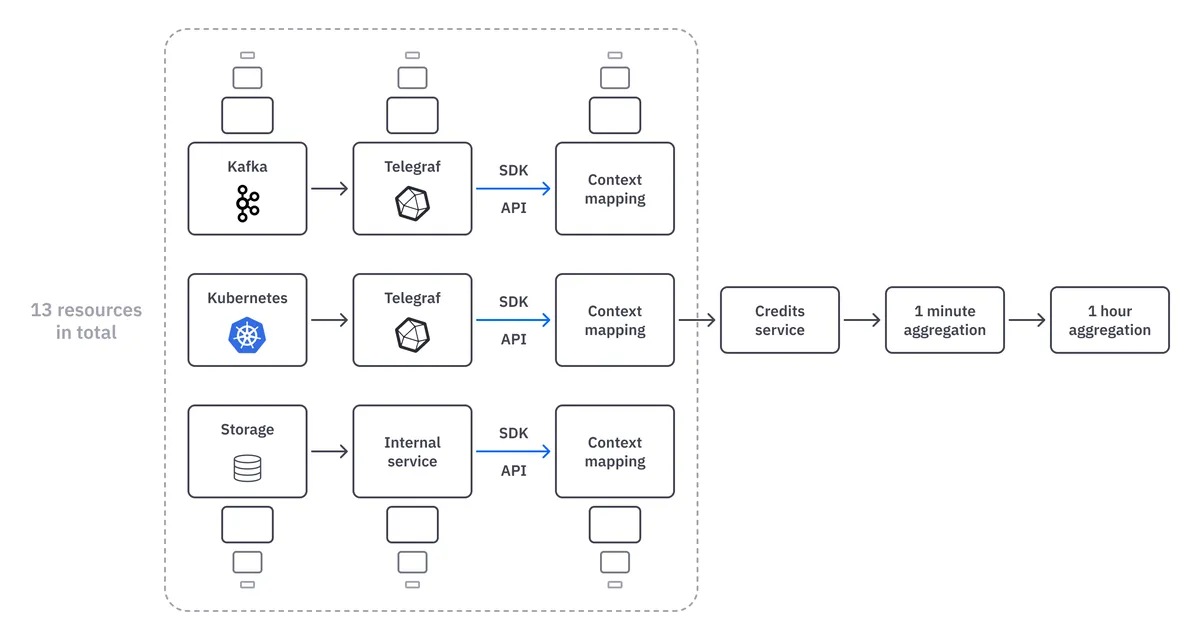
Collecting data from consumable resources
In the first part of the pipeline, data is streamed from the backend of each consumable resource — Kafka, Kubernetes, Storage, Telegraf and our API services.
We sample the raw data at a very high rate (millisecond resolution) and send it into the pipeline in real time. The data is standardized into our business schema using the SDK, which simplifies downstream processing throughout the pipeline.
Adding context to the consumption data (external data, cache, tags)
Typically, not all information travels with the raw data, either because the amount of information is too great or information is not available in the data source.
Our case isn’t an exception. We need to add context to the raw data. For example, the CPU and memory usage data from our Kubernetes deployments are only sent with the Kubernetes Pod name from Telegraf. But we need to assign this data to a customer, so we need to add metadata such as the OrganizationID to the raw stream.
Because we have this information in our internal databases, we only need to query them using a simple Redis-type cache system between the database and the microservice. The Quix SDK provides a cache out of the box to make this easier.
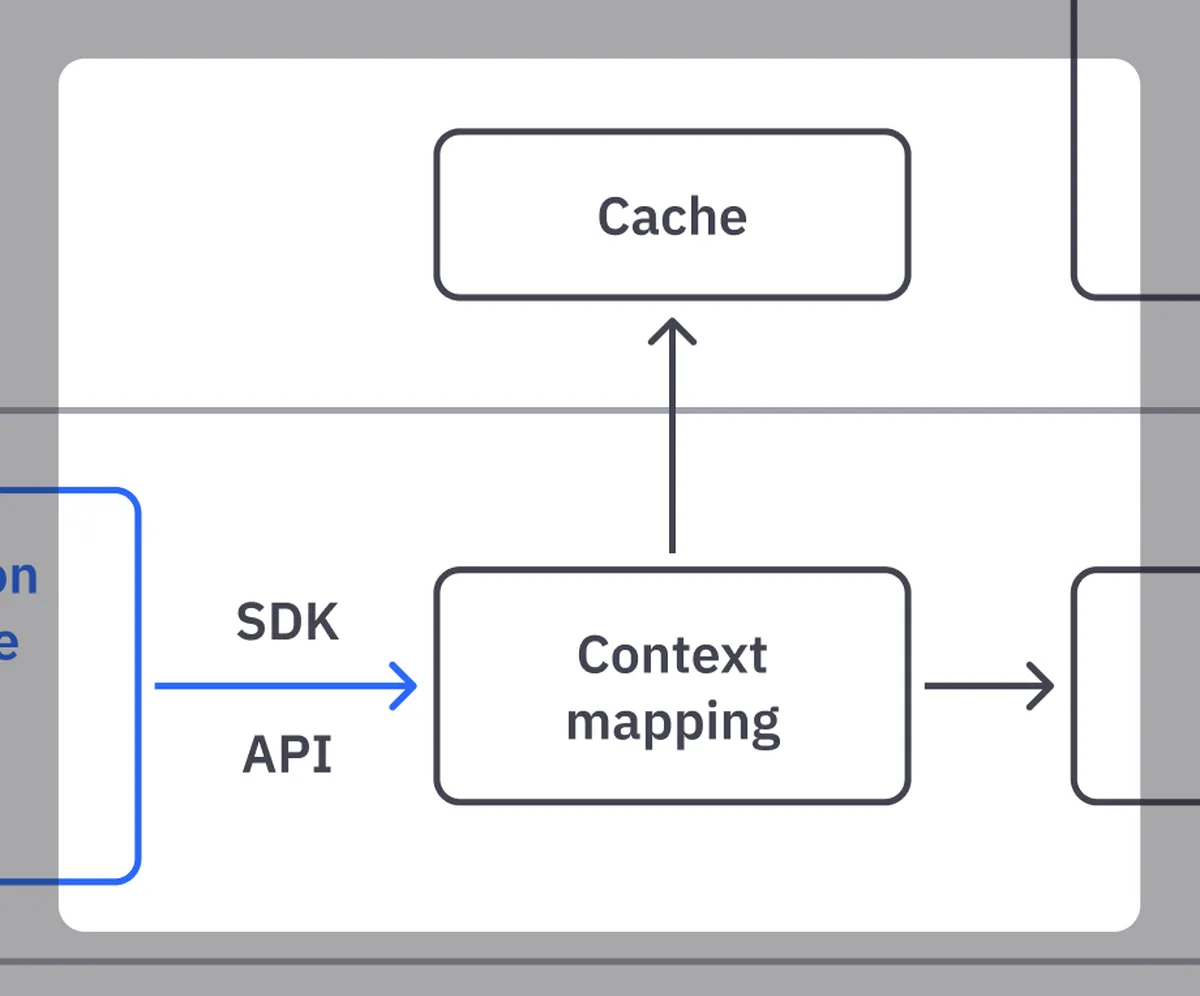
Ok, let’s see some code. The following code is the primary method for adding context to our deployment usage data. (You can click on the code to enlarge it on your screen.)
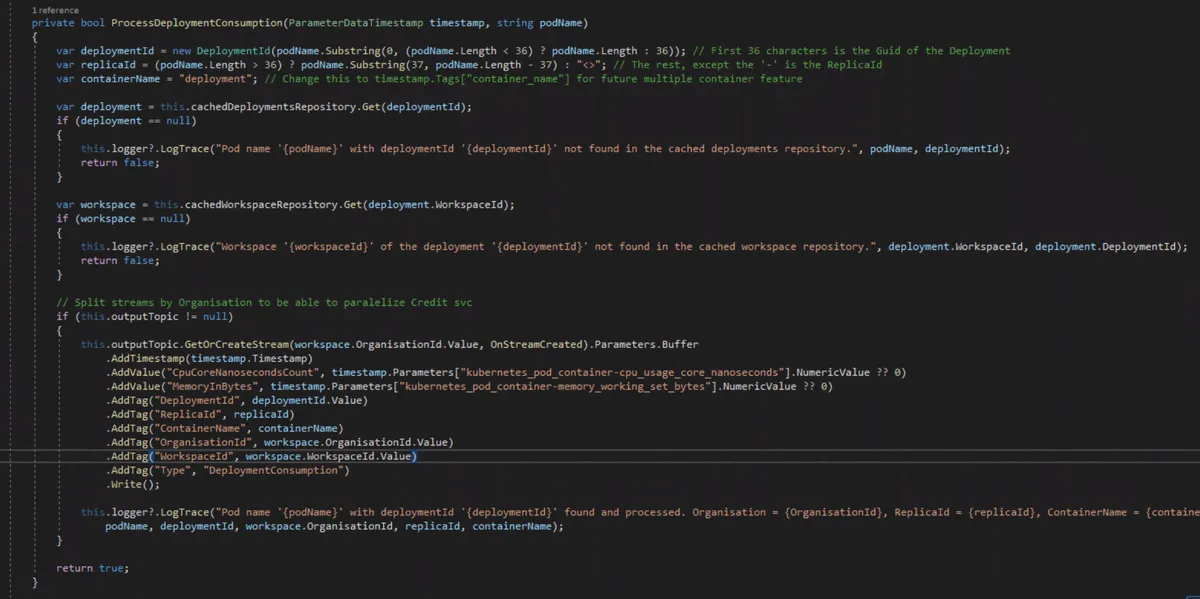
We do the following (remember that we are only getting the pod name from Kubernetes):
- Get the DeploymentID from the pod name
- Query the cache to get the deployment that the Pods belong to
- Query the cache to get the workspace that the deployment belongs to
- Query the cache to get the organization that the workspace belongs to
- Write the consumption data to a stream with the contextual information attached as metadata
Notice that we use tags to attach the contextual information to the raw data.
The Quix SDK lets us tag any metadata to the data we send through the pipeline. The data science world commonly uses tagging, which allows for data categorization so that a service or machine learning model can process it.
In our case, we use tags for convenience and efficiency. The Quix SDK easily compresses tags, which speeds up a query to the time-series database.
Credit Service: Calculating customers’ usage-based bills
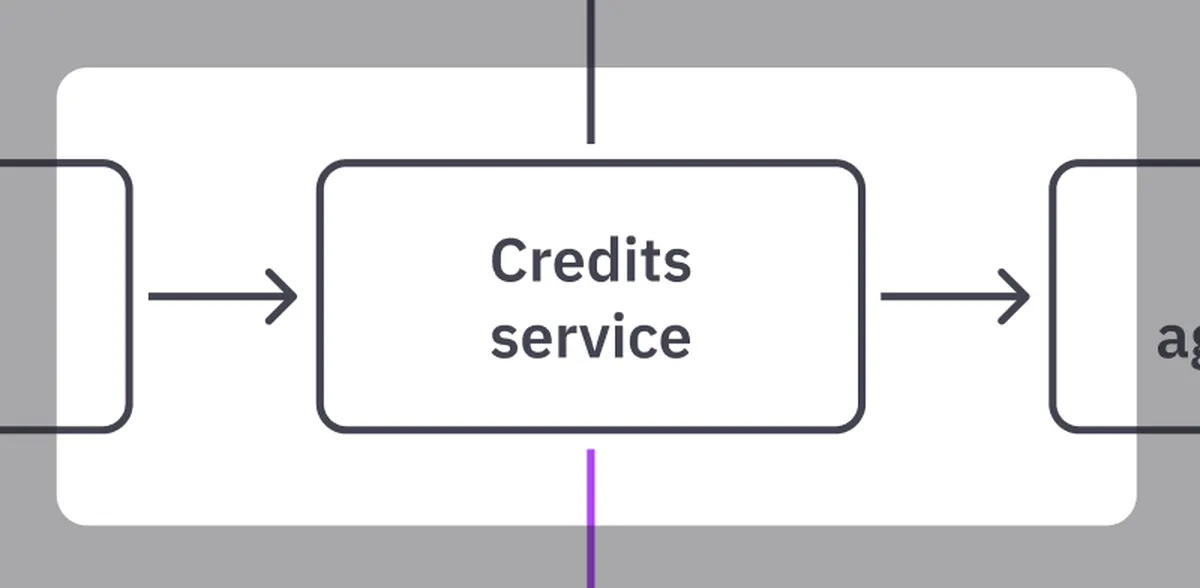
Credit Service is the core of our billing system. It takes all consumptions from the previous step (context mapping) and calculates a price in Quix credits in real time. It also tracks the speed at which credits are consumed and calculates the remaining credits at any given point. It then generates events and sends all the processed data back to the pipeline.
It doesn’t seem a complex job to take a consumption, calculate the price, discount the consumption from the organization and generate events. Let’s see some code of the primary method of that process:
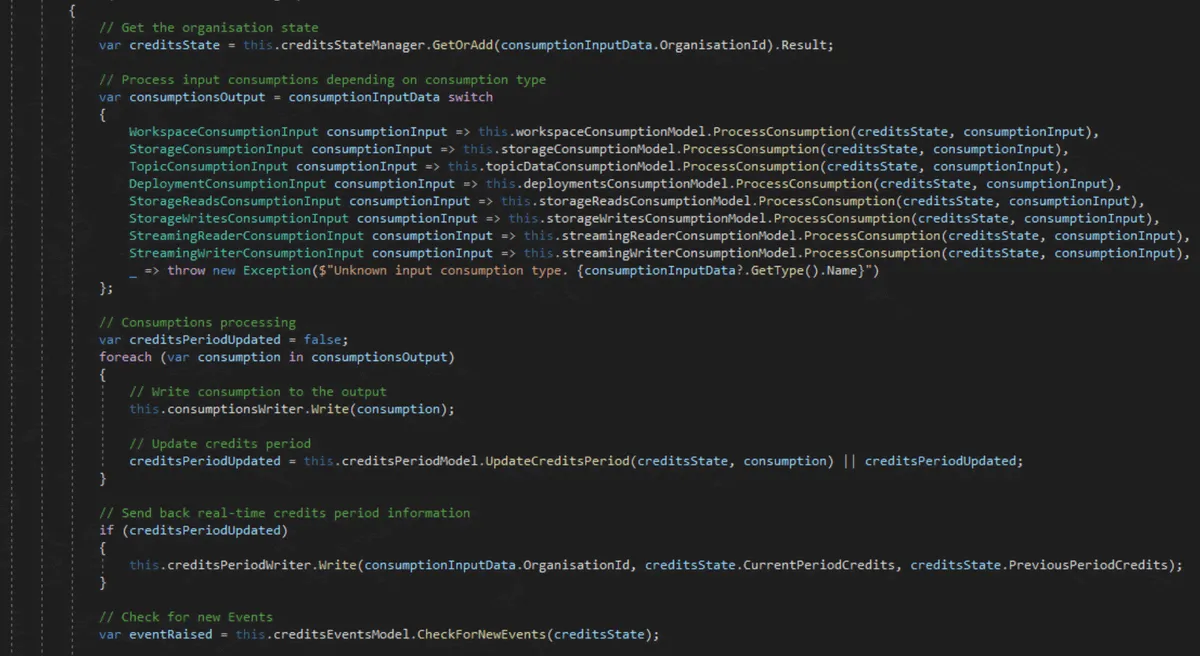
Notice that we are getting a state on the first line of this main method. This is the state of the credits of the organization.
It contains all the consumptions of the organization in the current billing period and the remaining credits. The job is simple. We get the state, update the consumptions and remaining credits, and generate the events if necessary.
But when you are managing a state in a streaming application, you have to consider that you cannot load and save that state for each received message. Otherwise, the database would blow up, and the main benefit of using a message broker-centric approach would stop making sense.
So your state will live most of the time in memory, and this introduces some additional challenges in terms of scalability and resiliency of your implementation that we should tackle on our Credit Service.
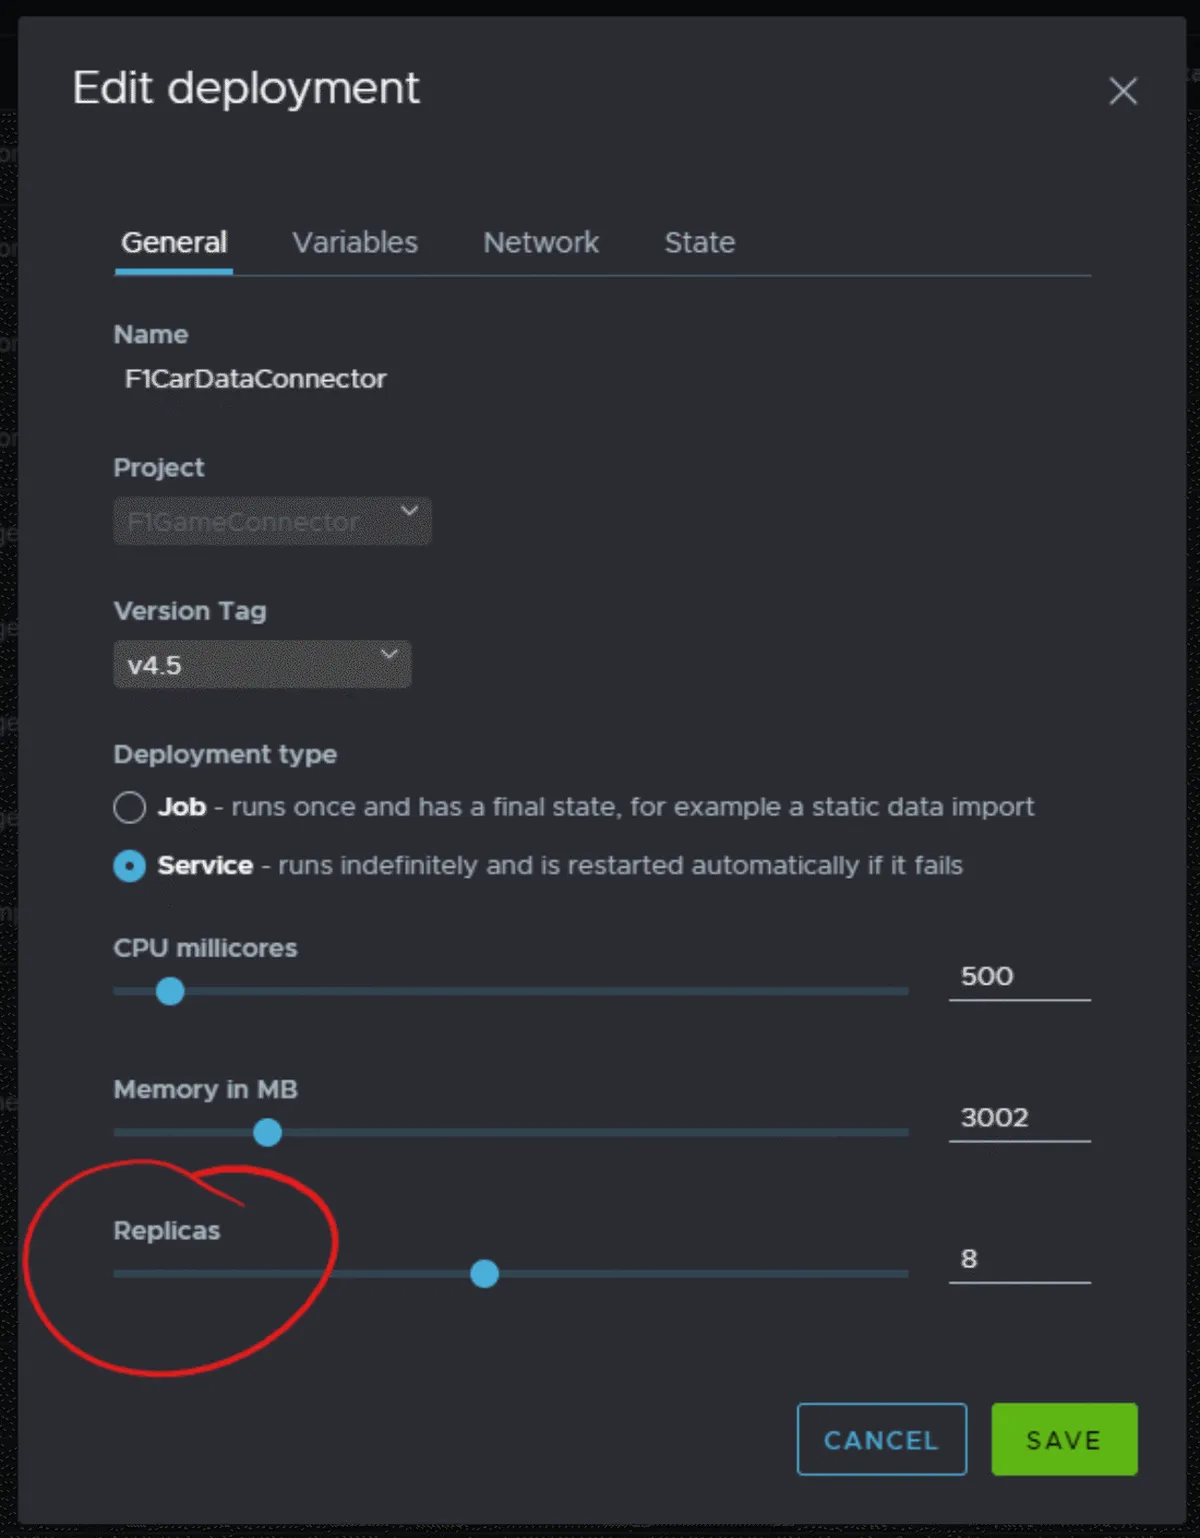
Scaling our Credit Service (Quix stream context and replicas)
We have mentioned that our billing system must process 13 consumable resources — and we need to build for the scale of our customers. What will happen if hundreds of thousands of customers create millions of consumption data per second?
You might ask, why not just add instances of each service? And you’d be correct! But it’s not so simple. We have to guarantee that the same instance of the service processes all data of one organization. Otherwise, you can end up with an inconsistent in-memory state.
For example, imagine two replicas simultaneously processing the same data from the same organization. This would cause us to hold two remaining credit values (in-memory state) for the same organization — one from each service replica. Which one should we persist to the database?
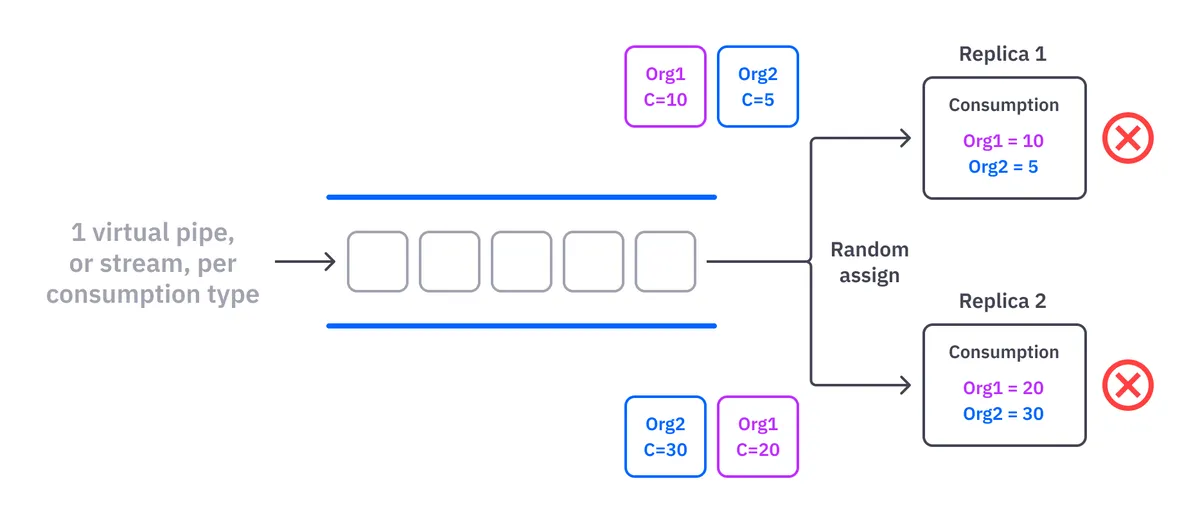
The answer is none of them. Both are incorrect. So, the organization should be the other cardinality point on our scalability separation, so “13 consumption types * the number of organizations” is the final number of virtual stream processing pipelines on our billing system.
Quix SDK provides the stream concept, a virtual pipeline inside a topic. Our pipeline easily scales once we decide on the correct separation of the data, thanks to Kafka partitions and Quix SDK stream abstractions. The system will assign each stream to only one replica, which avoids the previous problem of two replicas processing messages of the same organization twice.
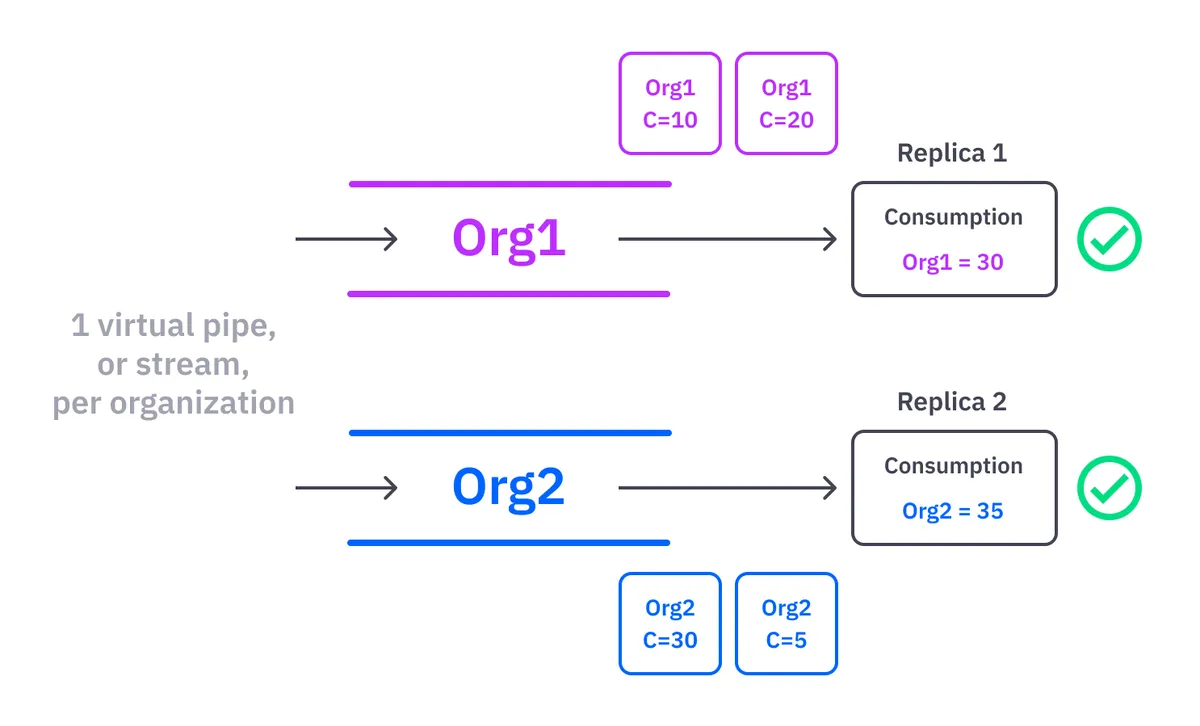
The SDK allows us to create an infinite number of virtual pipelines, what we call streams, inside the same topic. The system guarantees the order of the messages inside these streams. Quix streams context allow you to scale quickly — just assign a proper context ID for your streams, increase or decrease the number of replicas of your service and the SDK will deal with all the problems behind the scenes.

Resiliency: Rebalancing data & processing across nodes
All complex systems occasionally fail, and you should always design for failure in your system. It’s essential to know how your system behaves when a failure occurs. Does the Credit Service recover itself? Will we lose data? Will our customers be affected?
Kafka comes with out-of-the-box features that improve pipeline resiliency, including consumer groups, partitioning and replication. But these features alone don’t solve every problem you face when building a resilient stream processing pipeline.
Kafka rebalancing is complicated
Kafka partitions can be rebalanced anytime a new consumer is added or removed to a consumer group or when one of the Kafka nodes goes down. These rebalancing events are critical in your services because all the in-memory state that was being processed by a revoked partition has to be stopped and probably persisted at that moment to avoid losing data.
Very useful, but hard to implement. As an example, let’s see what happens if we use the native Kafka library (without using Quix SDK) to deal with rebalancing a partition.
Imagine “Partition 2” of our consumptions topic is being processed by “Replica 1” of our Credit Service, but that “Partition 2” gets reassigned to a second replica “Replica 2” because of some failure.
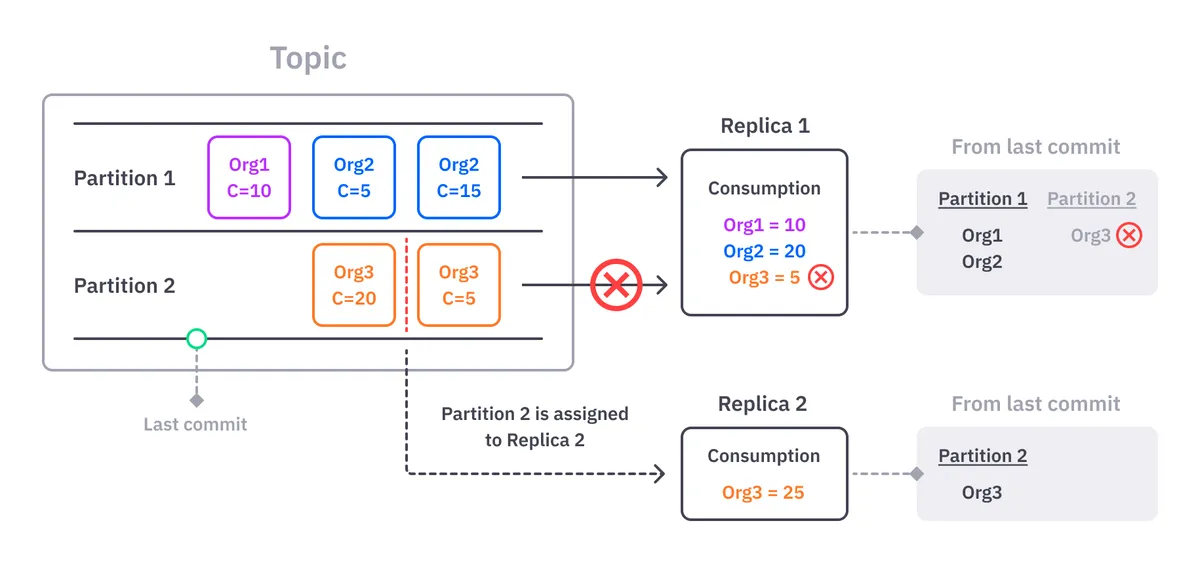
While Kafka can give us the revoked partition, it can’t give us any context about what data in that partition was processed. In our case, it means that we don’t know which organizations got revoked from “Replica 1.” We need this information to clean our in-memory state and avoid persisting an incorrect state of a customer that “Replica 2” will start processing.
The only way to achieve this with Kafka is by writing and maintaining a bespoke table in your service that tracks the active partitions and the customers processed by it. The table would get updated each time a new organization message arrives at the service or a partition revocation happens.
However, sometimes Kafka raises false revocation events. It will say that a partition was revoked and immediately reassign the same removed partition, causing your state to be deleted when it shouldn’t.
This partitioning concept is terrible to manage when working directly with the native Kafka library. It gets even more complicated when you deal with commits and offsets, concepts that we have avoided in this explanation to simplify the example.
Quix SDK provides a better way to handle partition rebalancing
The streaming context feature of the Quix SDK removes the partitioning concept from the equation. You don’t have to worry about it. Instead, the SDK solves all these problems while presenting a simple and powerful concept that we call a stream.
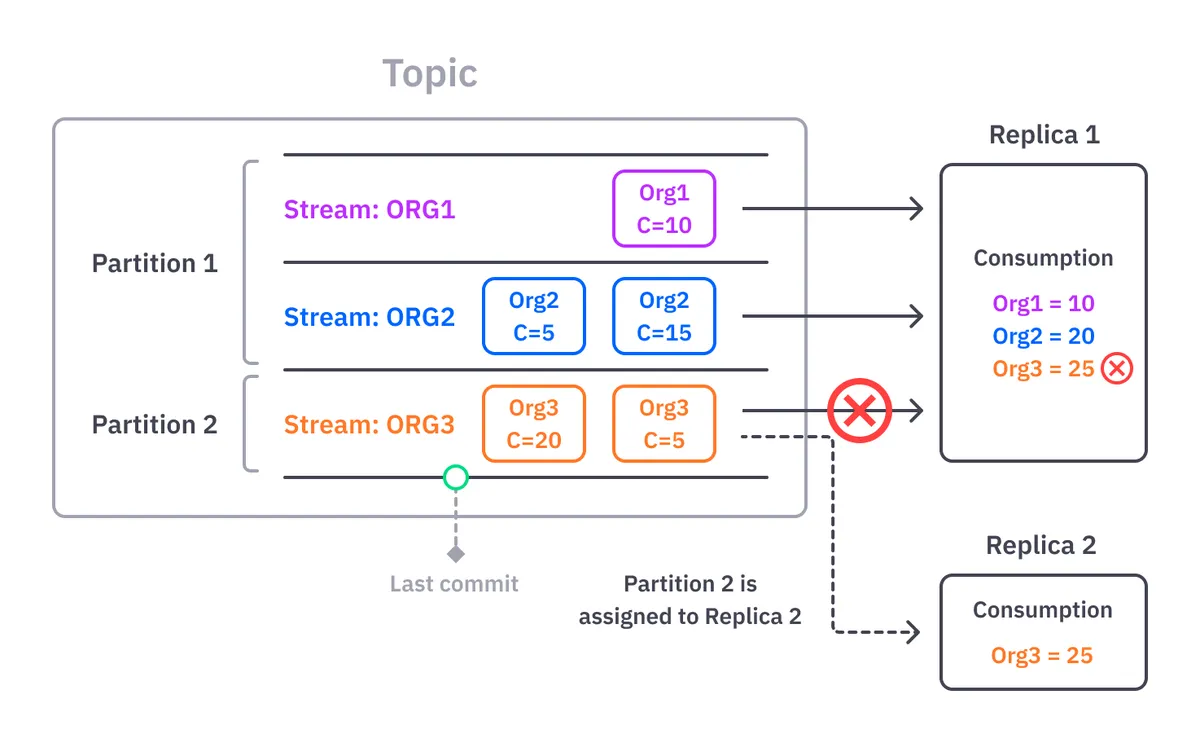
A stream is like a channel inside a topic that infinitely scales. You use metadata to assign a context to your streams. Our context in this example is an OrganizationID, so we have one stream per customer. You can use any metadata to assign a stream context and then all the hassle of managing partitions with your service replicas is handled for you.
Unlike partitions that can contain any message with any context, everything coming from a stream belongs to the same context. For example, we subscribe to the OnStreamsRevoked event of our input topics and execute the proper cleaning of the state in our Credit Service:


Because we don’t need to deal with partitions, we don’t have to worry about the relationship between partitions and consumers. The Quix SDK also solves (behind the scenes) a set of other problems and edge cases such as reconnections, partitions reassignments and errors, etc., so you don’t need to worry about handling them in your services anymore.
Ultimately this means that you can be sure that your stream processing pipeline is (almost) guaranteed to function correctly all the time.
Reacting fast to billing events: Disable workspaces and emails
We needed the ability to quickly react to events in our billing system, which is one of the reasons we chose a message broker-centric approach. For instance, we need to respond immediately when an organization runs out of credits to avoid unnecessary infrastructure costs.
Every consumption of an organization processed by the Credit Service executes these lines of code to check if the organization has run out of credits:

The response time must be fast because we process all the messages in real time upstream before any aggregation or persisting process happens. Moreover, the RunOutOfCredits events are generated without delay to our internal services through an internal EventBus.
Real-time data visualization: The billing page and Streaming Reader API
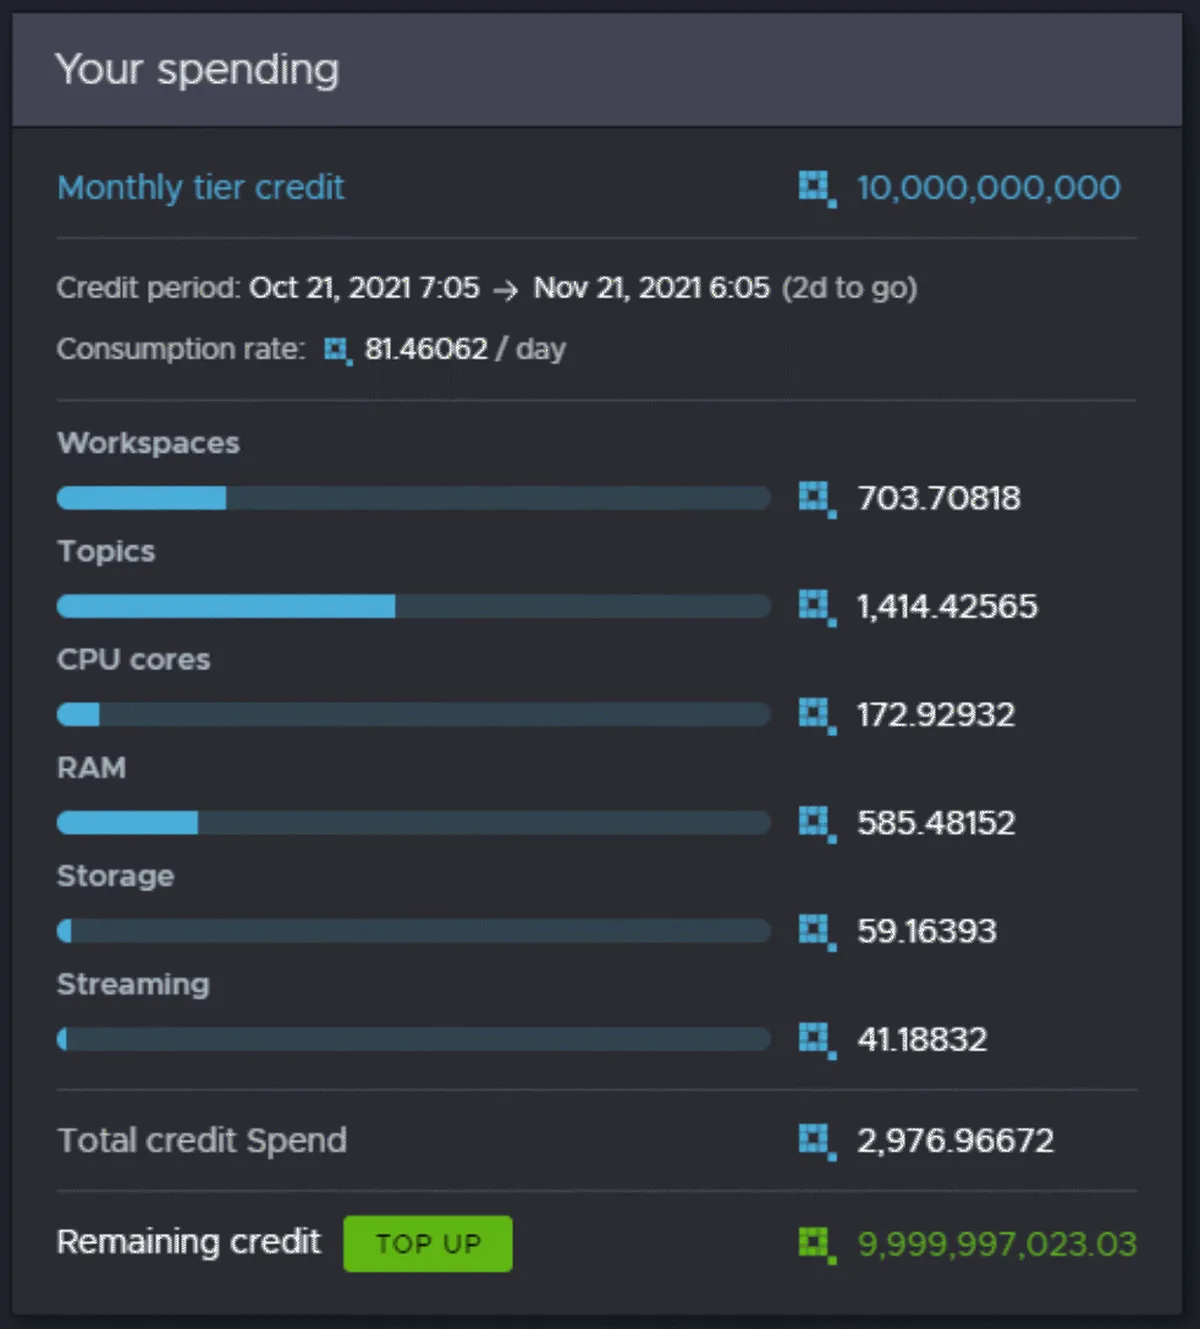
We didn’t start with the goal of showing real-time billing consumptions to our customers, but we realized along the way that our existing API ecosystem provided this feature — so, why not use it?
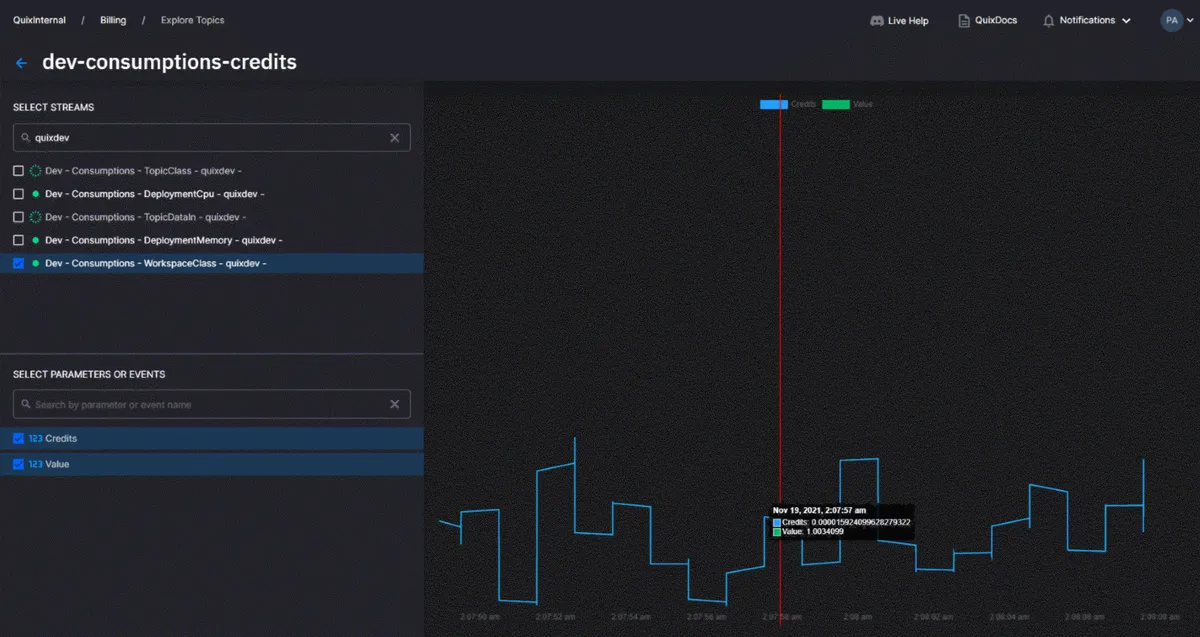
The Streaming Reader API comes in each Quix workspace. It allows for the connection to any topic of our pipeline and consumes data in real time via Websockets interface.
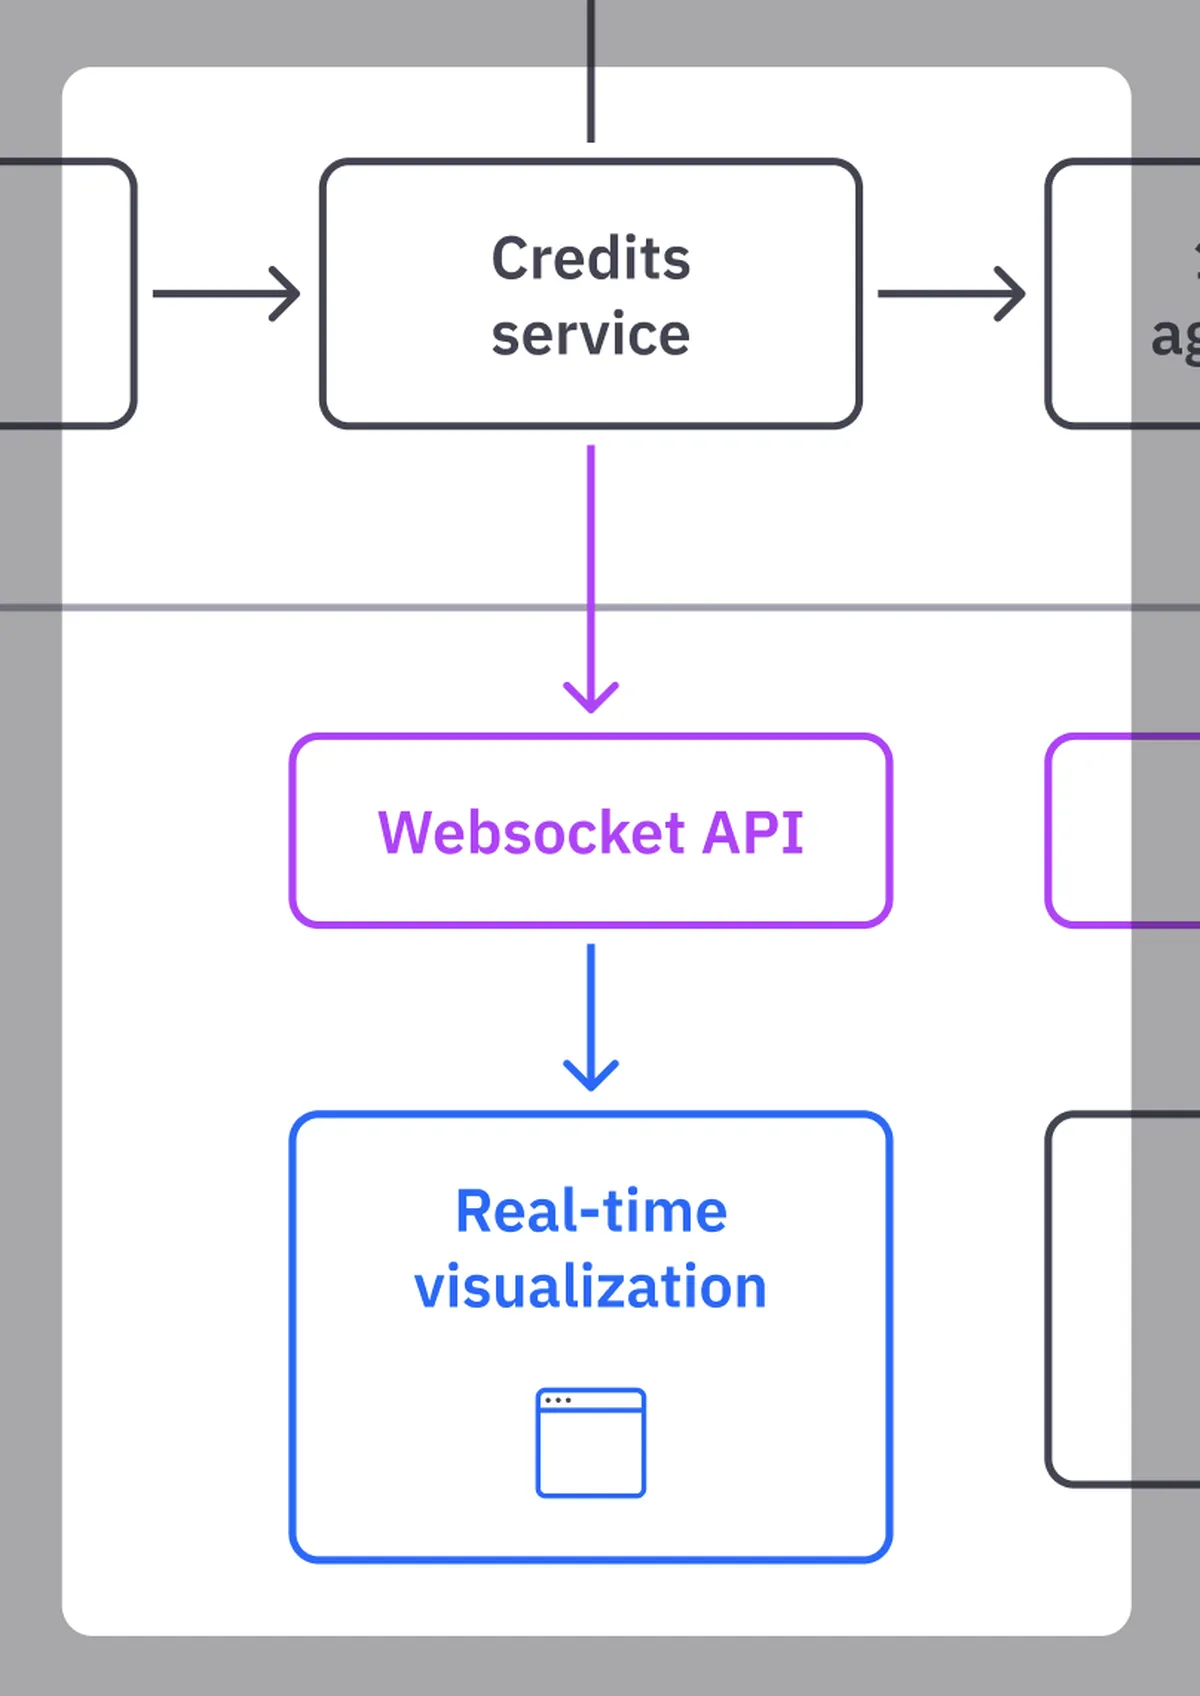
We just need to create a short Javascript code and a simple visualization that shows all the information coming from our Credits Service. The result of this is our billing page, where the user can see the consumptions in Quix in real time with millisecond precision.
Load stream processed data to storage: Aggregators
The last part of our pipeline is the aggregation of the consumptions data into one-minute and one-hour aggregations. This is granular enough for our billing reports and dashboards.
It’s necessary to aggregate the data before persisting it to the streaming-processing database. You probably don’t need a stream processing pipeline if you ingest your raw data into a database before cleaning or aggregating it in your use case — or you might not have realized you need it yet.
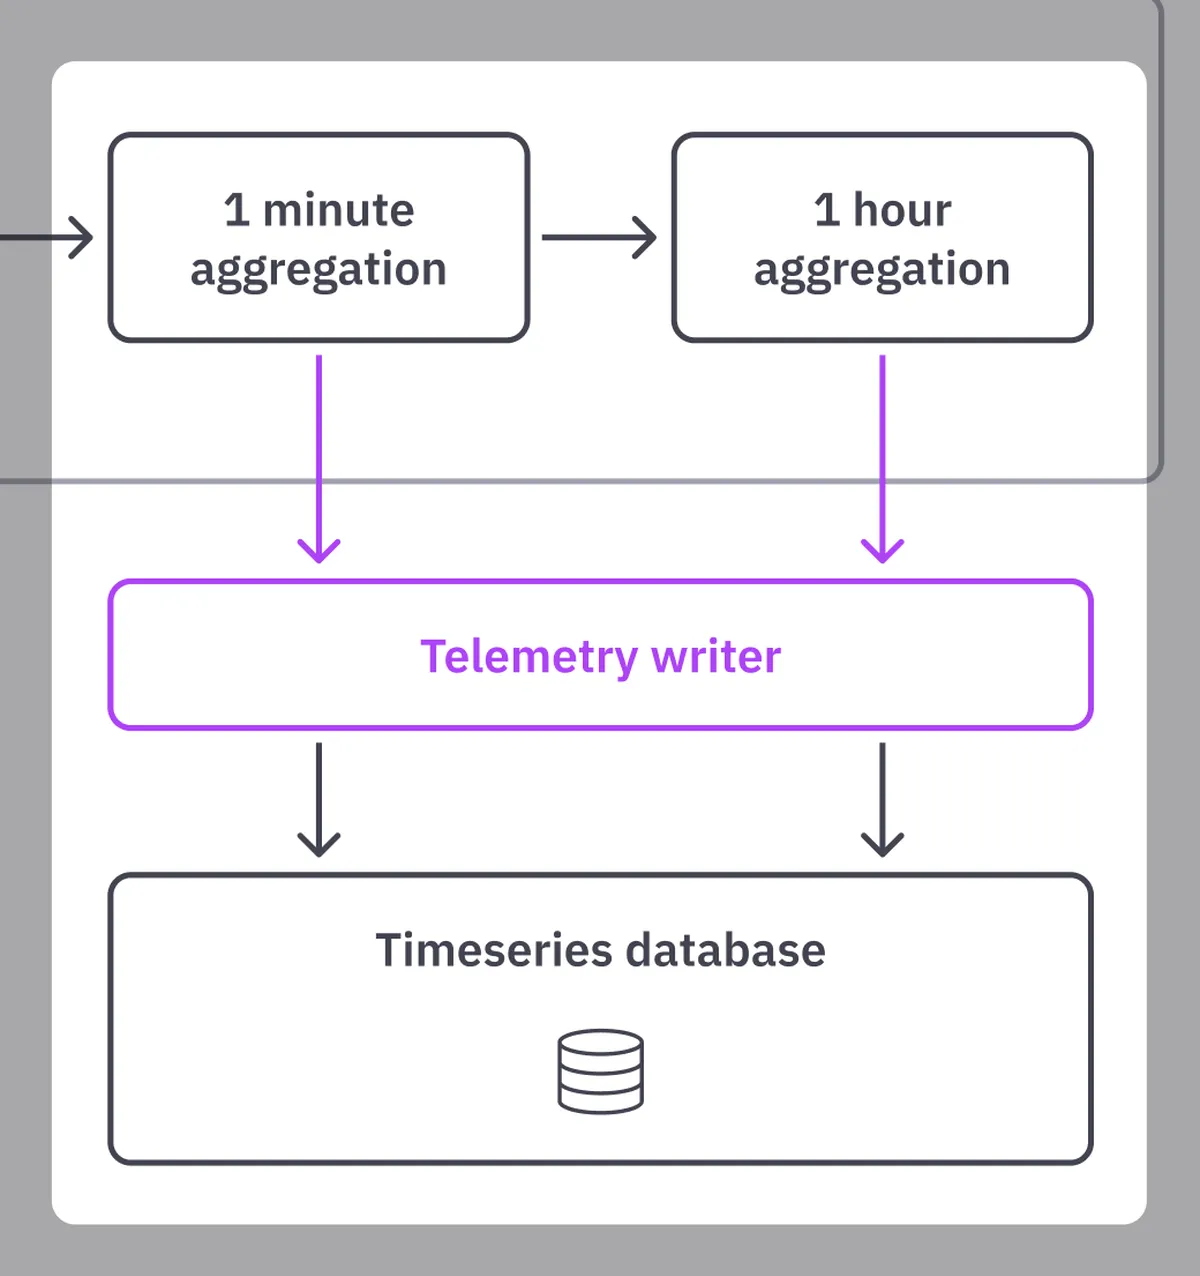
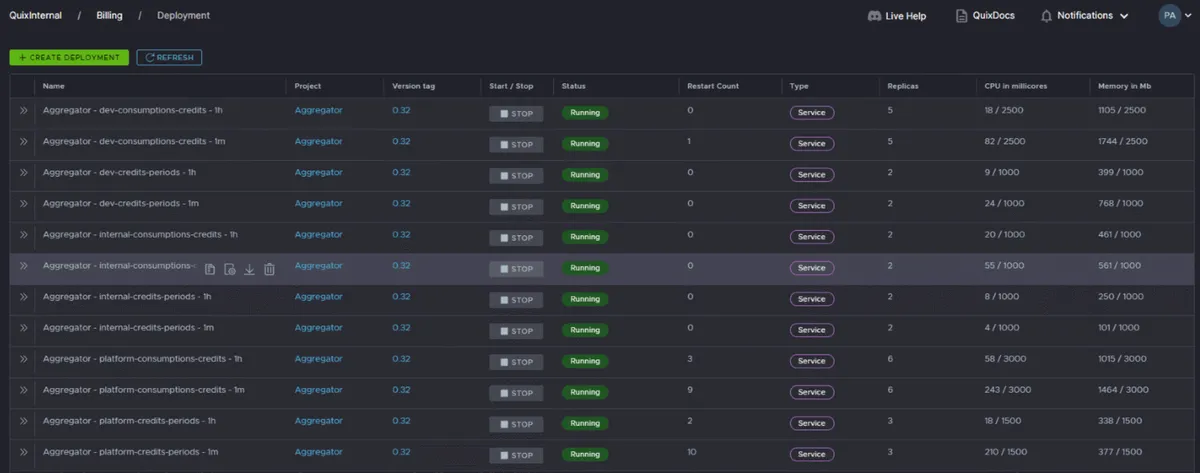
These aggregators are relatively expensive in terms of CPU and memory when compared to the other elements of our pipelines. Our billing requires averages and sums across a minute for each combination of data groups, which creates a high demand for computation operations. But this is a one-time processing cost rather than a cost incurred each time you query your time-series database.
Our Quix setup
We use Quix to set up the infrastructure and services necessary to connect this microservices architecture, which only takes a few clicks in the Quix interface.
We created two workspaces in light of performance concerns. A workspace is an entire Quix environment. They operate like infrastructure and offer security isolation.
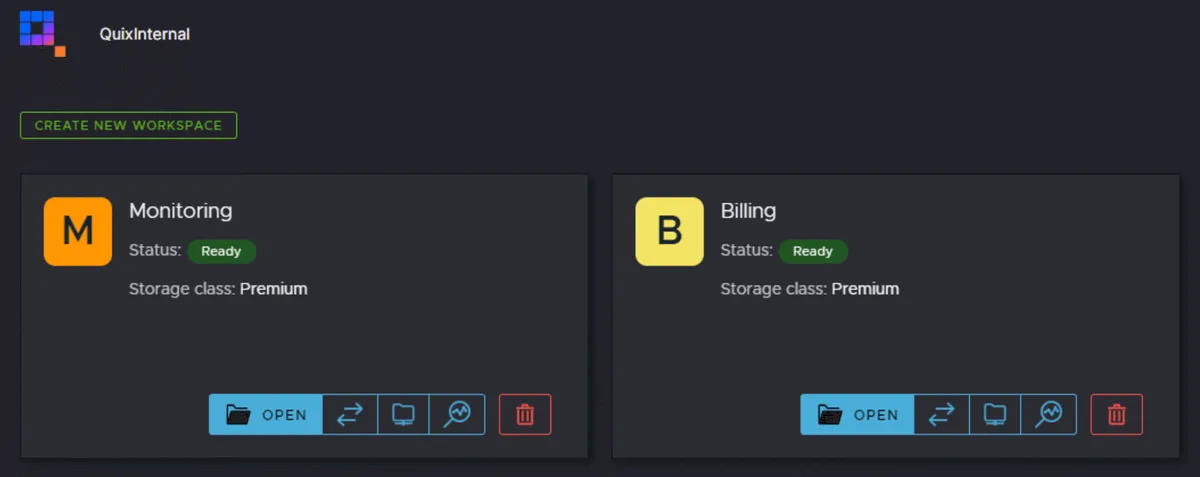
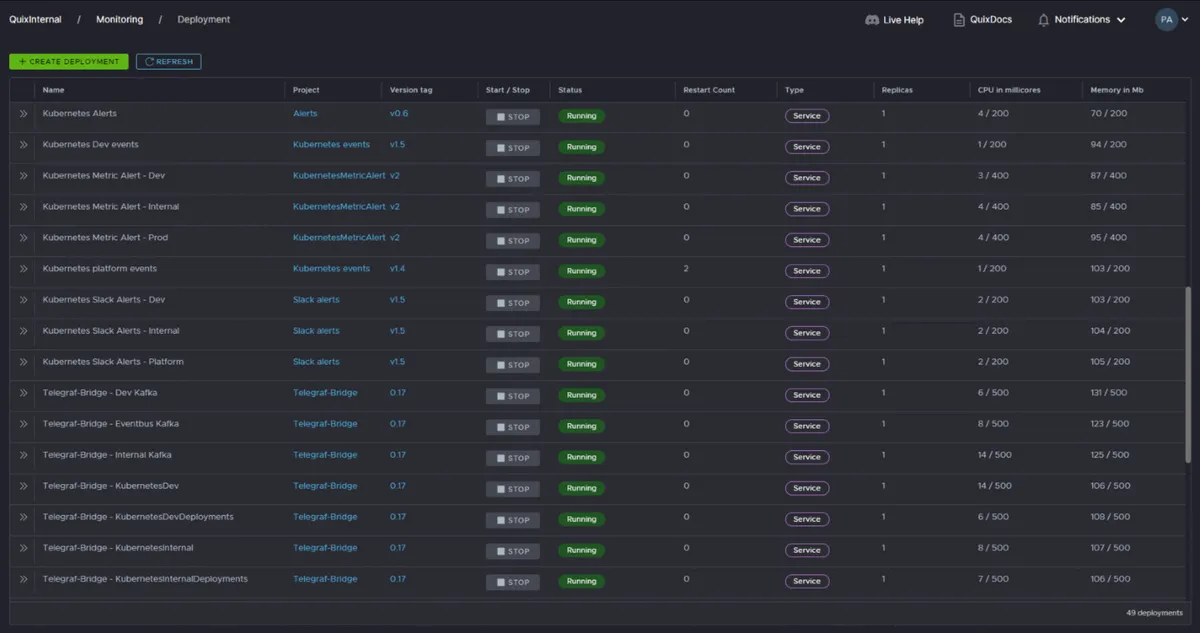
We have one workspace for monitoring and another for billing. Monitoring contains the first part of the pipeline, where we collect the raw consumptions and attach the context. We also use the monitoring workspace to watch and manage the billing system.
The billing workspace includes the last part of the pipeline to process the already contextual consumptions. We use the billing information to bill, check that our system is healthy and create some alerting processes that send us events in case that something goes wrong in the platform. Both workspaces will have different scalability needs in the future.
To set up this system, we first create the Kafka topics needed for each connection in our pipeline. Each microservice should have its own input topic to make use of the SDK streaming context capabilities. This enables the ability to scale the connected microservices infinitely.
At this point, we can enable the automatic persistence of the topics that will save all the data of the aggregators to the time series database of the workspace. This allows us to query the historical billing data (Query API) and generate billing information for our customers.
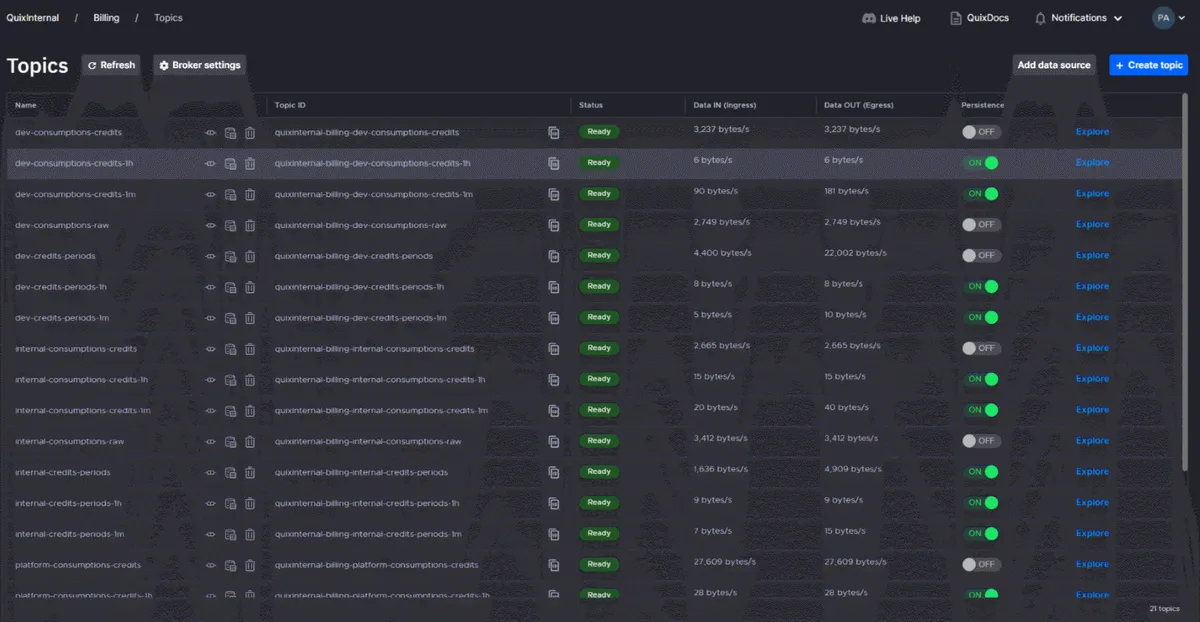
Now we can start deploying our microservices in the workspace. Quix lets us develop and deploy our microservices into the serverless environment of the workspace by clicking a few buttons in the portal. Create, Start, and Stop deployments buttons, among a few others, allow you deploy services to Kubernetes without any previous knowledge of these technologies.
Conclusion: now we have a platform to build on
Now that our data is cleaned, filtered and stored in a reliable stream processing system, it becomes very easy to build additional systems.
For example:
- We quickly added Grafana dashboards for monitoring and management of the billing. These respond quickly to the one-minute and one-hour aggregations so we can explore a vast quantity of data without effort.
- We can create and send very detailed invoices by querying the customer data periodically and sending the results to SendGrid templates.
- We haven’t built it yet, but we can even give customers a portal to access their own raw billing data for their own auditing purposes.
- Again, not built, but we can automate accounting systems by reconciling payments with invoices.
- Finally, we can look at implementing variable pricing plans based on the availability of our resources and the demands from our customers.
And best of all, we can continue to add features as our product develops. If you’re considering using usage-based billing in your business — or perhaps upgrading your existing system — book a consultation with us to learn more or chat with us in our Slack community.

Check out the repo
Our Python client library is open source, and brings DataFrames and the Python ecosystem to stream processing.
Interested in Quix Cloud?
Take a look around and explore the features of our platform.
Interested in Quix Cloud?
Take a look around and explore the features of our platform.

.svg)


