.svg)
Releases
Sep 15, 2025
Quix Cloud's unified data platform: Lake, replay, and dynamic configs
Transform test rig data management with Quix Cloud's unified platform: centralized data lake, replay systems, and dynamic configs for engineers.


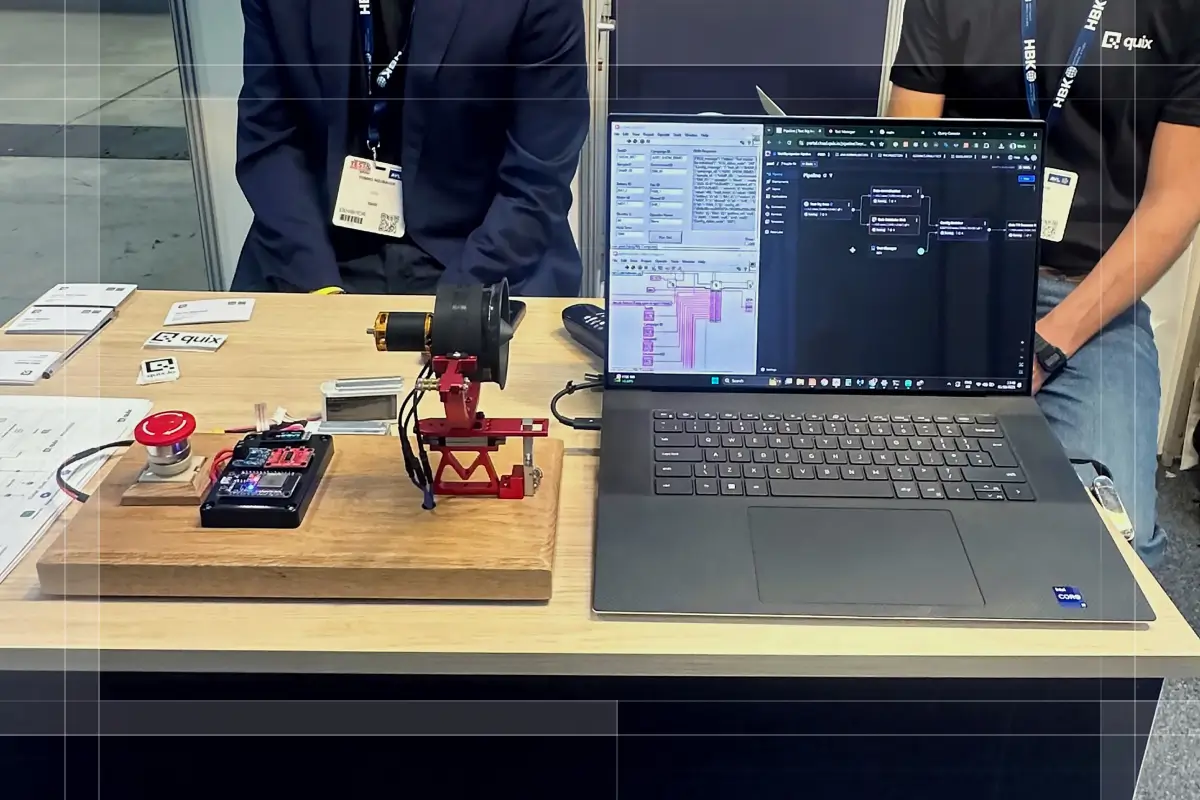
Quix Cloud's latest release transforms how engineering teams take control of test rig data with three major capabilities: centralized data lake storage, high-fidelity replay systems, and dynamic configuration management. This comprehensive update addresses the fragile internal solutions that plague engineering teams working with wind tunnels, climate chambers, simulators, and other testing environments.
New features
Quix Lake - All your test data in one place: Your Kafka streams now persist automatically in open formats (Avro and Parquet) on your existing cloud storage infrastructure. This eliminates the scattered CSV files, USB drives, and network shares that make it impossible to find critical test data when you need it. Raw message fidelity is preserved including timestamps, headers, partitions, offsets, and even gaps in data streams.
For wind tunnel testing teams, this means terabytes of pressure sensor data, force measurements, and environmental conditions from multiple test campaigns automatically flow into a searchable, organized data lake. No more hunting through folders named "Test_Run_Final_v2_ACTUALLY_FINAL" on different engineers' desktops.
The system architecture includes three integrated components designed specifically for engineering workflows. DataLake.Sink handles the persistence of raw Kafka messages with full fidelity, ensuring no critical measurement points are lost during high-frequency data acquisition. DataLake.Replay enables streaming of persisted datasets back into Kafka for exact test condition reproduction. The comprehensive DataLake.API provides Python-first access to browse, search, and manage datasets through both integrated UI and REST endpoints.
Climate chamber engineers can instantly locate thermal cycling data from last quarter's component validation tests instead of spending hours reconstructing test parameters from fragmented desktop files. The open data formats mean you can pull results directly into Python, Jupyter notebooks, or existing analysis tools without vendor lock-in.
Managed Services System - Replace fragile internal solutions: Deploy pre-built, Quix-maintained applications without managing the brittle scripts and custom tools that break every time someone leaves the team. This directly addresses the resource constraints that engineering teams face when trying to maintain homegrown data solutions while focusing on actual product development.
Quix handles all container image management, versioning, and security updates while you maintain complete control over deployment timing through latest or pinned version strategies. Configuration uses descriptive, engineer-friendly parameters rather than cryptic environment variables that only one person understands.
Deploy services directly from the Quix UI with guided workflows or use YAML configurations for integration with existing CI/CD pipelines. This flexibility supports both rapid prototyping workflows and the controlled deployment processes that regulated industries require for compliance and change management.
Dynamic Configuration Manager - Auto-join test and config data: Manage and version large configuration files (JSON or binary formats) for test equipment, sensors, and measurement systems without requiring manual file distribution or system restarts. Simulator engineers can update vehicle parameters, environmental conditions, and sensor configurations across distributed test rigs in real-time during extended test campaigns.
The system works seamlessly with the Quix Streams Python SDK, which automatically fetches, caches, and joins the right configuration values with live measurement streams. This eliminates the manual spreadsheet tracking and email-based configuration distribution that leads to test invalidation when parameters don't match.
Storage flexibility includes MongoDB for fast access to frequently changing configurations, plus object storage options (S3, GCS, Azure Blob) for large configuration files such as detailed component models or extensive sensor calibration datasets. The embedded UI provides intuitive management capabilities without requiring database expertise or IT support.
Typical use cases include test rig sensor mappings that change based on component variants, environmental chamber profiles that adapt to different test standards, and dynamic measurement configurations that need to synchronize across multiple test facilities without manual intervention.
Plugin System - Python-first workflow integration: Services can now expose embedded user interfaces directly within Deployment Details through secure iframe rendering. Optional sidebar shortcuts provide quick access to analysis tools without context switching between multiple applications.
This architectural approach streamlines complex engineering workflows where you need to monitor live measurement streams while simultaneously adjusting test parameters or viewing analysis results. Battery test engineers can monitor charging cycle data in real-time while accessing thermal management controls in the same interface.
Blob Storage Integrations - Open data formats via API: Connect Quix Cloud clusters directly to your existing cloud storage infrastructure across all major providers (S3, GCS, Azure Blob, MinIO). This integration enables advanced data lake capabilities while leveraging storage investments your organization has already made.
The connection process handles authentication and permissions automatically, reducing the configuration overhead that typically delays proof-of-concept implementations. Engineering teams can start consolidating scattered test data immediately without waiting for new infrastructure procurement or lengthy approval cycles.
Enhanced features
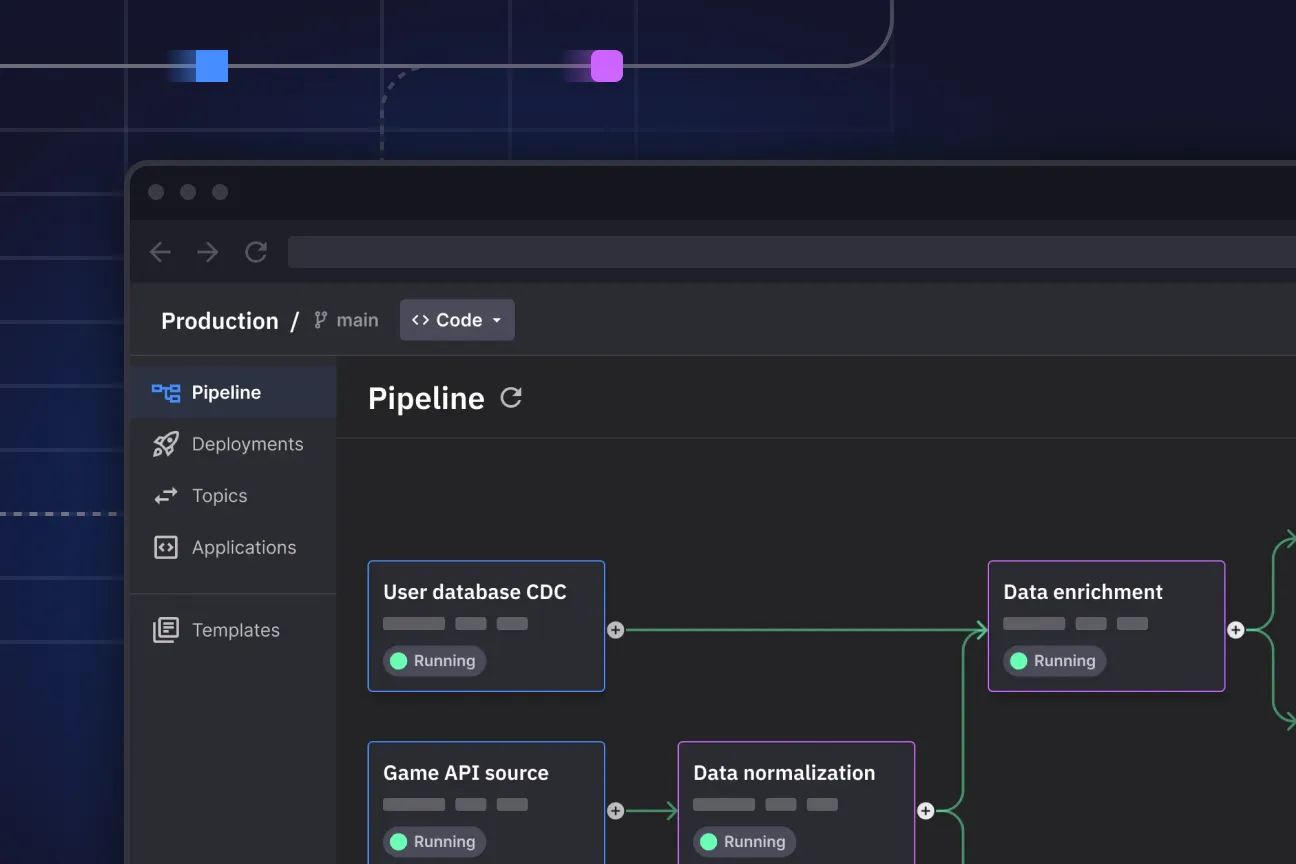
Pipeline visualization improvements - Control your data flow: New toolbar functionality addresses usability challenges when working with complex measurement and analysis pipelines. Zoom in, zoom out, center, fit, and reset controls provide precise navigation through large data processing workflows. Essential for teams working with multi-stage test sequences or those using devices without scroll wheel functionality.
Complex test environments often involve dozens of interconnected data processing stages from raw sensor acquisition through final analysis. The enhanced visualization tools help test engineers and data analysts understand measurement flow relationships without losing context when focusing on specific processing segments.
Cluster monitoring enhancements - Real results in real time: Historical monitoring views now include granular filtering by Project, Environment, and Deployment dimensions. This precision enables engineering teams to analyze resource utilization patterns for specific test campaigns or validation phases rather than viewing aggregated metrics that obscure important performance trends.
Shared cluster summary displays clearly show CPU and Memory usage metrics even when total capacity calculations aren't available due to dynamic scaling or mixed hardware configurations. This visibility helps teams make informed decisions about resource allocation during intensive testing periods or parallel test execution.
AWS ECR native support - Professional-grade platform reliability: Automatic authentication integration supports multiple credential approaches including IAM Roles for Service Accounts (IRSA), AWS Access Keys, and default credential chains. Token caching with automatic refresh eliminates the manual credential management overhead that disrupts automated test workflows.
This enhancement supports organizations using AWS-based infrastructure where container security and access management are critical compliance requirements. Engineering teams can focus on test execution and analysis rather than managing authentication tokens and credential rotation schedules.
Bug fixes and stability improvements
Library filter isolation - Maintain workflow control: Fixed an issue where filters applied in the Connectors section incorrectly carried over to Services and other library views. Each section now maintains independent filtering state, preventing workflow confusion when switching between different system configuration tasks.
This fix eliminates frustration where engineers would apply filters to find specific connectors, then switch to services configuration and wonder why expected services weren't visible due to inherited filter states.
Build service log streaming - Complete deployment visibility: Build service logs now stream from the very beginning, ensuring early build steps including project compilation and Docker optimization are visible in real-time. Complete visibility is critical for debugging deployment issues, especially for complex projects with multiple compilation stages or custom dependencies.
Previously, engineers missed early build failures because log streaming started after initial setup phases. The enhanced streaming provides complete troubleshooting visibility from project initialization through final deployment.
Deployment type marker correction - Accurate system status: Corrected deployment type marker display in the deployments list interface. Accurate visual indicators improve system status visibility, helping engineers quickly identify different service types during system monitoring and troubleshooting.
Real-world impact across testing environments
High-fidelity replay eliminates test repetition: DataLake.Replay enables streaming historical datasets back into Kafka for exact reproduction of test conditions. Wind tunnel engineers can replay weeks of aerodynamic testing data to validate new analysis algorithms against real measurement scenarios including edge cases that are expensive to reproduce physically.
This capability eliminates the cost and scheduling complexity of recreating specific test conditions or waiting for particular environmental situations to occur naturally. Rocket engine test teams replay precious engine firing data for multiple analysis runs without risking hardware damage or consuming expensive test fuel.
Automotive testing teams replay challenging road test scenarios captured from instrumented vehicles to validate control system responses. The precise timing relationships between sensors are maintained, critical for understanding vehicle dynamics and safety system behavior during complex maneuvers.
Dynamic configurations eliminate test setup delays: Automotive teams testing powertrain systems can update ECU parameters, sensor calibrations, and control maps across multiple dynamometer test cells instantly rather than scheduling individual cell downtime for manual updates. This capability dramatically reduces the time between algorithm improvements and validation testing.
Climate chamber operations benefit from real-time configuration updates that adapt to different test standards or component variants without interrupting ongoing thermal cycling campaigns. Manufacturing validation teams can adjust measurement parameters based on product variants or quality requirements without stopping production line testing.
Battery management system engineers update charging profiles and thermal management parameters across distributed test equipment as new cell chemistry data becomes available, ensuring consistent testing conditions across multiple research facilities.
Centralized data replaces fragile solutions: The unified data lake approach transforms how engineering teams share knowledge and build on previous work. Complex product development involves multiple specialist teams using different tools and measurement systems. Quix Lake creates a single source of truth where mechanical engineers, test technicians, and data analysts can access the same underlying measurements in formats appropriate for their specific analysis workflows.
This consolidation addresses the common problem where valuable test data and analysis results become trapped in individual desktop solutions, making it difficult for teams to validate design decisions against historical performance data or learn from previous test campaigns.
Python-first approach maintains engineering control: Unlike black box data platforms that force engineers into vendor-specific tooling, Quix maintains the flexibility that engineering teams need. Pull test data directly into Python scripts, Jupyter notebooks, or existing analysis pipelines using standard formats (CSV, Parquet, JSON). Integration with existing workflows means teams can adopt Quix capabilities incrementally rather than replacing entire analysis toolchains.
Modern engineering generates massive measurement volumes from increasingly complex test environments. Scattered CSV files, fragile internal scripts, and manual data consolidation create bottlenecks that slow validation cycles and fragment institutional knowledge. A Python-first platform with centralized data lake capabilities, replay functionality, and dynamic configuration management helps engineering teams transition from reactive data hunting to proactive test optimization.
The combination of persistent measurement storage, high-fidelity replay capabilities, and real-time configuration management creates a foundation for more efficient testing workflows that scale with system complexity rather than being overwhelmed by scattered data management.
Take control of your test rig data with unified infrastructure that accelerates validation cycles and improves collaboration across engineering teams working on complex system development.
Last updated:
Sep 17, 2025

Check out the repo
Our Python client library is open source, and brings DataFrames and the Python ecosystem to stream processing.
Interested in Quix Cloud?
Take a look around and explore the features of our platform.
Interested in Quix Cloud?
Take a look around and explore the features of our platform.