Four solutions for handling time series data
Most data in streaming applications such as IoT, finance, user behavior analysis and automotive is time-series data. Learn how to capture, process and apply it to get the most value from it.
Why time series data saves you time and effort — when you handle it correctly
Most data in streaming applications such as IoT, finance, user behavior analysis and automotive is time series data. Time series data refers to a group of data points indexed in time order. Such data can be described by a series of values taken at fixed points in time. Time series data is usually sampled at equally spaced points in time; this is often the easiest and results in the most meaningful data since it can be compared at like-for-like intervals. Regardless of the application, the time index is one of the most valuable properties of data.
In our collective experience, we’ve formulated and tested solutions to common problems that arise when dealing with time series data.
For multiple parameters, use tables.
In use cases where we measure multiple parameters at the same time, it is practical and efficient to send data in table-like structures. This is in contrast to the key-value approach other technologies use (Kafka Streams, for example). The Quix SDK supports panda’s data frames, which are popular in the data science community.
For data streams with various speeds, use buffering.
Quite often, data is collected and streamed from different data sources and, although that data were recorded at the same time, they have not arrived on the platform simultaneously. We provide buffer capability in our SDK to help with this problem. As a result, related data can be analyzed together with its timestamp as a unifying guide.
To acquire time series data, use a replay service.
Getting live data into a platform so data scientists can analyze and use it often involves a long lead time. This can be because a complicated streaming infrastructure needs to be in place first, the data source itself is complicated, or a third party provides the data. As a result, most projects start with some sort of static historical data collected offline. Usually, this data is handed over to data scientists in CSV or JSON files. Data scientists can then start analyzing data to understand it, but this format is difficult to build in a real-time pipeline.
We introduced replay capability in the Quix platform that enables data scientists to import data from historic files into the platform, but also replay that data as streams as if they were live. This enables the building of a real-time processing pipeline. This replay capability enables data scientists to start building real processing blocks months (or sometimes years) before actual live data is streamed into the platform. When the integration effort is completed, and real data is flowing into the platform, the processing pipeline seamlessly switches from replayed streams to real streams.
For performance, don’t put a database at the center of your architecture.
In the Formula 1 world, we dealt with massive amounts of time series data from car sensors. We learned:
- There is no magic database solution for all types of data. There are good time series databases, good document-store databases, and good relational databases. Each technology excels in one area but falls short in at least one other.
- The database is in the way of scaling your streaming analytics platform. Options are typically limited to scaling vertically or using a limited, expensive sharding solution.
- Database infrastructure is expensive. It’s multiple orders of magnitude more expensive per million values processed than using a message broker like something like Kafka. For example, recording parameter-based data such as temperature readings over time as a sequence of events is approximately 145 times more memory- and storage-intensive than recording this data as a continuous stream.
Of course, this doesn’t mean we should just throw out the database. We need a database, just not at the core of our architecture.
At Quix, we use best-in-class database technologies, working together under the hood of our data catalog, to give our customers great performance in all areas. If persistence is enabled on a topic, data streamed using our SDK are persisted in the data catalog in an optimal way. This is completely orthogonal to the live processing pipeline and can be used for model training purposes, historical exploration, or to build dashboards.
The Quix data catalog is not a simple data lake, where JSON messages or CSV files are stored. Data sent via the SDK is parsed and persisted in context and in the time domain. That means:
- Data is efficiently accessible for queries (aggregations, masking, grouping, etc.).
- Very efficient data compression is possible — we do not need to save 1,440 messages from a day of temperature sensor data if it remained at a steady -18°C for three hours.
- Data can be served in a desirable format — e.g. Panda data frame format for model training.
Get going faster with Quix
Quix is a developer-first platform. Sign up to get started immediately with our free plan and try it out today — it might cover all your needs. I hope you’ll agree with me that Quix lets you focus on value-added activities.
Check out the repo
Our Python client library is open source, and brings DataFrames and the Python ecosystem to stream processing.
Interested in Quix Cloud?
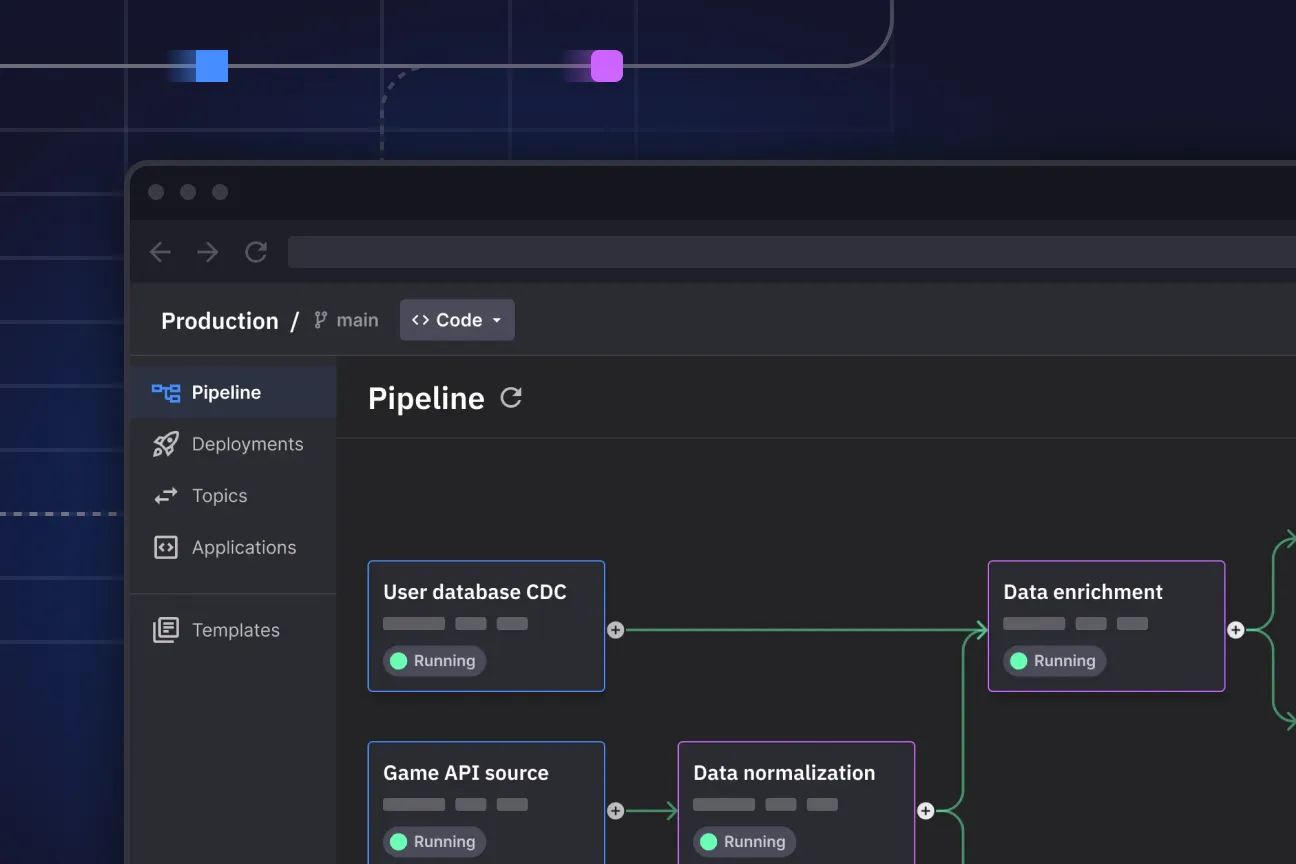
Take a look around and explore the features of our platform.
Interested in Quix Cloud?
Take a look around and explore the features of our platform.

.svg)


